
Page 109 - CityofSouthlakeFY26AdoptedBudget
P. 109
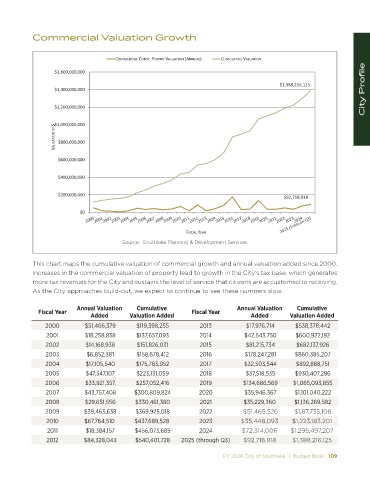
Commercial Valuation Growth


                                        KDD Z / >  KE^d͘ W ZD/d s >h d/KE ; EEh >Ϳ   hDh> d/s  s >h d/KE
                                                                                                                          City Profile
                   Ψϭ͕ϲϬϬ͕ϬϬϬ͕ϬϬϬ

                                                                                              Ψϭ͕ϯϴϴ͕Ϯϭϲ͕ϭϮϱ
                   Ψϭ͕ϰϬϬ͕ϬϬϬ͕ϬϬϬ

                   Ψϭ͕ϮϬϬ͕ϬϬϬ͕ϬϬϬ


                   Ψϭ͕ϬϬϬ͕ϬϬϬ͕ϬϬϬ
                   s >h d/KE /E Ψ  ΨϴϬϬ͕ϬϬϬ͕ϬϬϬ


                    ΨϲϬϬ͕ϬϬϬ͕ϬϬϬ


                    ΨϰϬϬ͕ϬϬϬ͕ϬϬϬ


                    ΨϮϬϬ͕ϬϬϬ͕ϬϬϬ                                                               ΨϵϮ͕ϳϭϴ͕ϵϭϴ

                           ΨϬ


                                                               &/^  > z  Z
                                         Source:  Southlake Planning & Development Services


            This chart maps the cumulative valuation of commercial growth and annual valuation added since 2000.
            Increases in the commercial valuation of property lead to growth in the City’s tax base, which generates
            more tax revenues for the City and sustains the level of service that citizens are accustomed to receiving.
            As the City approaches build-out, we expect to continue to see these numbers slow.


                          Annual Valuation    Cumulative                       Annual Valuation    Cumulative
              Fiscal Year                                       Fiscal Year
                               Added        Valuation Added                         Added        Valuation Added
                2000          $51,466,379      $119,398,255        2013            $17,976,714     $538,378,442
                2001          $18,258,838      $137,657,093        2014           $42,543,750      $600,922,192
                2002          $14,168,938      $151,826,031        2015            $81,215,734      $682,137,926
                2003          $6,852,381       $158,678,412        2016           $178,247,281     $860,385,207
                2004          $17,105,540      $175,783,952        2017           $32,503,544      $892,888,751
                2005          $47,347,107      $223,131,059        2018            $37,518,535     $930,407,286
                2006          $33,921,357      $257,052,416        2019           $134,686,569     $1,065,093,855
                2007         $43,757,408      $300,809,824         2020           $35,946,367      $1,101,040,222
                2008          $29,651,556     $330,461,380         2021           $35,229,360      $1,136,269,582
                2009         $39,463,638      $369,925,018         2022           $51,465,526      $1,87,735,108
                2010         $67,764,510      $437,689,528         2023          $35,448,093      $1,223,183,201
                 2011         $18,384,157     $456,073,685         2024          $72,314,006     $1,295,497,207
                2012         $84,328,043      $540,401,728   2025 (through Q3)   $92,718,918      $1,388,216,125

                                                                           FY 2026 City of Southlake  |  Budget Book   109