
Page 114 - CityofSouthlakeFY26AdoptedBudget
P. 114
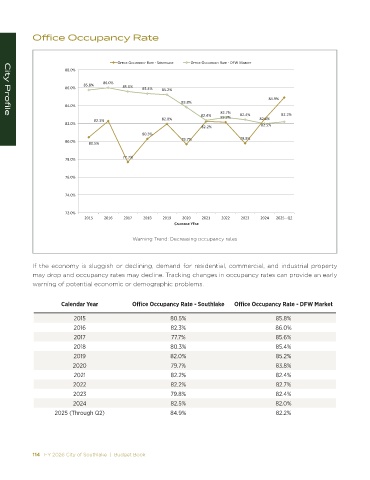
Office Occupancy Rate


                                        K&&/   K  hW E z Z d  Ͳ ^Khd,> <   K&&/   K  hW E z Z d  Ͳ  &t D Z< d
                       ϴϴ͘Ϭй

                             ϴϱ͘ϴй  ϴϲ͘Ϭй
                       ϴϲ͘Ϭй              ϴϱ͘ϲй  ϴϱ͘ϰй  ϴϱ͘Ϯй
                                                                                          ϴϰ͘ϵй
                                                             ϴϯ͘ϴй
                       ϴϰ͘Ϭй
                                                                          ϴϮ͘ϳй
                                                                   ϴϮ͘ϰй  ϴϮ͘Ϯй  ϴϮ͘ϰй        ϴϮ͘Ϯй
   City Profile
                                ϴϮ͘ϯй                  ϴϮ͘Ϭй                           ϴϮ͘Ϭй
                       ϴϮ͘Ϭй                                                           ϴϮ͘ϱй
                                                                    ϴϮ͘Ϯй
                                                ϴϬ͘ϯй
                                                             ϳϵ͘ϳй              ϳϵ͘ϴй
                       ϴϬ͘Ϭй  ϴϬ͘ϱй
                       ϳϴ͘Ϭй              ϳϳ͘ϳй


                       ϳϲ͘Ϭй


                       ϳϰ͘Ϭй

                       ϳϮ͘Ϭй
                             ϮϬϭϱ  ϮϬϭϲ   ϮϬϭϳ  ϮϬϭϴ   ϮϬϭϵ  ϮϬϮϬ   ϮϬϮϭ  ϮϬϮϮ   ϮϬϮϯ  ϮϬϮϰ  ϮϬϮϱ Ͳ YϮ
                                                             > E  Z z  Z

                                             Warning Trend: Decreasing occupancy rates


            If the economy is sluggish or declining, demand for residential, commercial, and industrial property
            may drop and occupancy rates may decline. Tracking changes in occupancy rates can provide an early
            warning of potential economic or demographic problems.


                     Calendar Year           Office Occupancy Rate - Southlake  Office Occupancy Rate - DFW Market

                         2015                            80.5%                              85.8%
                         2016                            82.3%                              86.0%
                         2017                             77.7%                             85.6%
                         2018                            80.3%                              85.4%
                         2019                            82.0%                              85.2%
                         2020                             79.7%                             83.8%
                         2021                            82.2%                              82.4%
                         2022                            82.2%                              82.7%
                         2023                            79.8%                              82.4%
                         2024                            82.5%                              82.0%
                   2025 (Through Q2)                     84.9%                              82.2%


            114   FY 2026 City of Southlake  |  Budget Book                                                                                                                                           FY 2026 City of Southlake  |  Budget Book   115