Page 111 - CityofSouthlakeFY26AdoptedBudget
P. 111

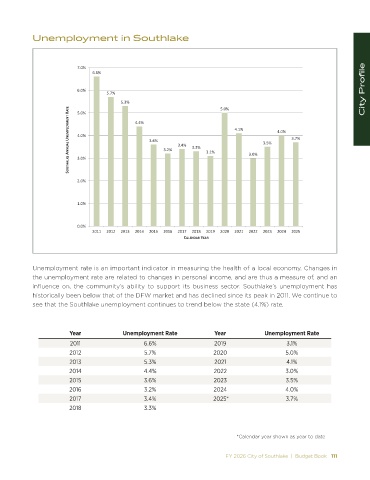
Unemployment in Southlake


                           ϳ͘Ϭй
                                ϲ͘ϲй


                           ϲ͘Ϭй                                                                                           City Profile
                                    ϱ͘ϳй
                                         ϱ͘ϯй                             ϱ͘Ϭй
                        ^Khd, ><   EEh > hE DW>KzD Ed Z d   ϰ͘Ϭй  ϰ͘ϰй  ϯ͘ϲй  ϯ͘Ϯй  ϯ͘ϰй  ϯ͘ϯй  ϯ͘ϭй  ϰ͘ϭй  ϯ͘Ϭй  ϯ͘ϱй  ϰ͘Ϭй  ϯ͘ϳй
                           ϱ͘Ϭй


                           ϯ͘Ϭй


                           Ϯ͘Ϭй


                           ϭ͘Ϭй


                           Ϭ͘Ϭй
                                ϮϬϭϭ  ϮϬϭϮ  ϮϬϭϯ  ϮϬϭϰ  ϮϬϭϱ  ϮϬϭϲ  ϮϬϭϳ  ϮϬϭϴ  ϮϬϭϵ  ϮϬϮϬ  ϮϬϮϭ  ϮϬϮϮ  ϮϬϮϯ  ϮϬϮϰ  ϮϬϮϱ
                                                                > E  Z z  Z


            Unemployment rate is an important indicator in measuring the health of a local economy. Changes in
            the unemployment rate are related to changes in personal income, and are thus a measure of, and an
            influence on, the community’s ability to support its business sector. Southlake’s unemployment has
            historically been below that of the DFW market and has declined since its peak in 2011. We continue to
            see that the Southlake unemployment continues to trend below the state (4.1%) rate.


                        Year              Unemployment Rate             Year             Unemployment Rate
                        2011                     6.6%                   2019                    3.1%
                        2012                     5.7%                   2020                    5.0%
                        2013                     5.3%                   2021                    4.1%
                        2014                     4.4%                   2022                    3.0%
                        2015                     3.6%                   2023                    3.5%
                        2016                     3.2%                   2024                   4.0%
                        2017                     3.4%                   2025*                   3.7%
                        2018                     3.3%


                                                                               *Calendar year shown as year to date


                                                                            FY 2026 City of Southlake  |  Budget Book   111
   106   107   108   109   110   111   112   113   114   115   116