Page 110 - CityofSouthlakeFY26AdoptedBudget
P. 110

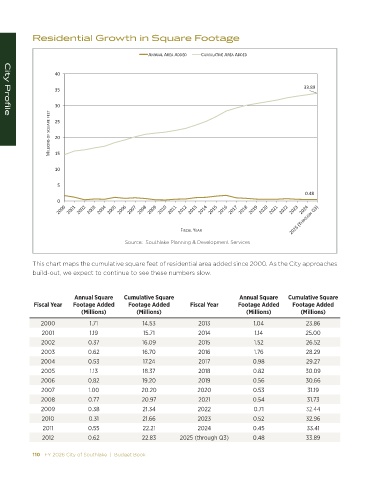
Residential Growth in Square Footage


                                                   EEh >  Z           hDh> d/s   Z

                   ϰϬ


                   ϯϱ                                                                                 ϯϯ͘ϴϵ

                   ϯϬ
                 D/>>/KE^ K& ^Yh Z  &  d  Ϯϱ
   City Profile


                   ϮϬ

                   ϭϱ

                   ϭϬ


                    ϱ
                                                                                                      Ϭ͘ϰϴ
                    Ϭ


                                                             &/^  > z  Z
                                          Source:  Southlake Planning & Development Services


            This chart maps the cumulative square feet of residential area added since 2000. As the City approaches
            build-out, we expect to continue to see these numbers slow.


                          Annual Square   Cumulative Square                     Annual Square   Cumulative Square
            Fiscal Year  Footage Added     Footage Added        Fiscal Year     Footage Added     Footage Added
                            (Millions)        (Millions)                          (Millions)        (Millions)
               2000            1.71             14.53              2013              1.04             23.86
               2001            1.19             15.71              2014              1.14             25.00
               2002           0.37              16.09              2015              1.52             26.52
               2003           0.62              16.70              2016              1.76             28.29
               2004           0.53              17.24              2017              0.98             29.27
               2005            1.13             18.37              2018              0.82             30.09
               2006           0.82              19.20              2019              0.56             30.66
               2007           1.00              20.20             2020               0.53              31.19
               2008           0.77              20.97              2021              0.54              31.73
               2009           0.38              21.34             2022               0.71             32.44
               2010           0.31              21.66             2023               0.52             32.96
               2011           0.55              22.21             2024               0.45             33.41
               2012           0.62              22.83        2025 (through Q3)       0.48             33.89

            110   FY 2026 City of Southlake  |  Budget Book                                                                                                                                           FY 2026 City of Southlake  |  Budget Book   111
   105   106   107   108   109   110   111   112   113   114   115