Page 108 - CityofSouthlakeFY26AdoptedBudget
P. 108

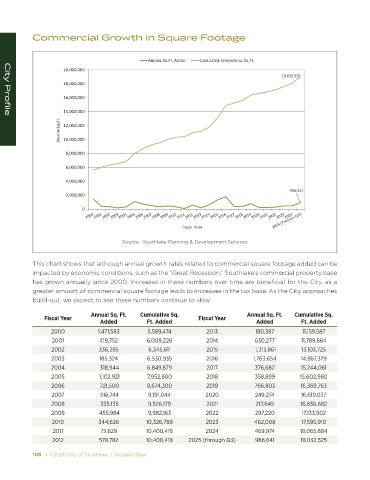
Commercial Growth in Square Footage


                                                   EEh > ^Y͘&d͘         hDh> d/s   KDD Z / > ^Y͘&d͘
                      ϮϬ͕ϬϬϬ͕ϬϬϬ
                                                                                              ϭϵ͕ϬϯϮ͕ϱϮϱ
                      ϭϴ͕ϬϬϬ͕ϬϬϬ

                      ϭϲ͕ϬϬϬ͕ϬϬϬ
                      ϭϰ͕ϬϬϬ͕ϬϬϬ
   City Profile
                      Z   /E ^Y͘&d͘  ϭϮ͕ϬϬϬ͕ϬϬϬ

                      ϭϬ͕ϬϬϬ͕ϬϬϬ

                       ϴ͕ϬϬϬ͕ϬϬϬ

                       ϲ͕ϬϬϬ͕ϬϬϬ

                       ϰ͕ϬϬϬ͕ϬϬϬ
                                                                                                 ϵϲϲ͕ϲϰϭ
                       Ϯ͕ϬϬϬ͕ϬϬϬ
                            Ϭ


                                                             &/^  > z  Z

                                         Source:  Southlake Planning & Development Services


            This chart shows that although annual growth rates related to commercial square footage added can be
            impacted by economic conditions, such as the “Great Recession,” Southlake’s commercial property base
            has grown annually since 2000. Increases in these numbers over time are beneficial for the City, as a
            greater amount of commercial square footage leads to increases in the tax base. As the City approaches
            build-out, we expect to see these numbers continue to slow.

                               Annual Sq. Ft.    Cumulative Sq.                    Annual Sq. Ft.    Cumulative Sq.
                Fiscal Year                                        Fiscal Year
                                  Added           Ft. Added                           Added          Ft. Added
                  2000           1,471,583        5,589,474          2013             180,387        11,159,587
                  2001            419,752         6,009,226          2014            630,277         11,789,864
                  2002            336,385         6,345,611          2015             1,313,861      13,103,725
                  2003            185,324         6,530,935          2016            1,763,654       14,867,379
                  2004             318,944        6,849,879          2017            376,682         15,244,061
                  2005            1,102,921       7,952,800          2018            358,899        15,602,960
                  2006             721,500        8,674,300          2019            766,803        16,369,763
                  2007             516,744        9,191,044          2020            249,274         16,619,037
                  2008             335,135        9,526,179          2021             217,645       16,836,682
                  2009            455,984         9,982,163          2022            297,220         17,133,902
                  2010            344,626        10,326,789          2023            462,008         17,595,910
                   2011           73,629         10,400,418          2024            469,974        18,065,884
                  2012            578,782        10,400,418    2025 (through Q3)     966,641        19,032,525

            108   FY 2026 City of Southlake  |  Budget Book                                                                                                                                          FY 2026 City of Southlake  |  Budget Book   109
   103   104   105   106   107   108   109   110   111   112   113