
Page 104 - CityofSouthlakeFY26AdoptedBudget
P. 104
Population Density
ϭ͕ϲϬϬ
ϭ͕ϱϭϵ
ϭ͕ϰϳϬ
ϭ͕ϰϬϬ
ϭ͕ϮϬϬ
City Profile
ϭ͕ϬϬϬ
Z ^/ Ed^ W Z ^Yh Z D/> ϴϬϬ ϵϯϲ
ϲϬϬ
ϰϬϬ
ϮϬϬ
Ϭ
ϭϵϵϵ ϮϬϬϬ ϮϬϬϭ ϮϬϬϮ ϮϬϬϯ ϮϬϬϰ ϮϬϬϱ ϮϬϬϲ ϮϬϬϳ ϮϬϬϴ ϮϬϬϵ ϮϬϭϬ ϮϬϭϭ ϮϬϭϮ ϮϬϭϯ ϮϬϭϰ ϮϬϭϱ ϮϬϭϲ ϮϬϭϳ ϮϬϭϴ ϮϬϭϵ ϮϬϮϬ ϮϬϮϭ ϮϬϮϮ ϮϬϮϯ ϮϬϮϰ ϮϬϮϱ ϮϬϮϲ ϮϬϮϳ ϮϬϮϴ ϮϬϮϵ ϮϬϯϬ
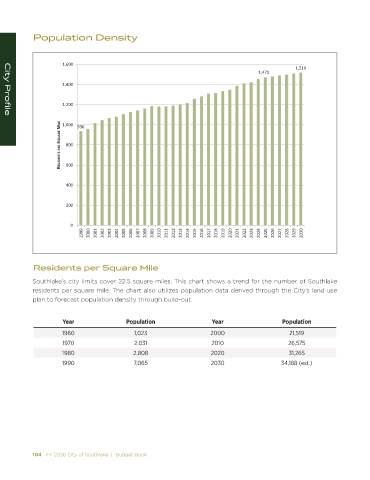
Residents per Square Mile
Southlake’s city limits cover 22.5 square miles. This chart shows a trend for the number of Southlake
residents per square mile. The chart also utilizes population data derived through the City’s land use
plan to forecast population density through build-out.
Year Population Year Population
1960 1,023 2000 21,519
1970 2,031 2010 26,575
1980 2,808 2020 31,265
1990 7,065 2030 34,188 (est.)
104 FY 2026 City of Southlake | Budget Book FY 2026 City of Southlake | Budget Book 105