
Page 107 - CityofSouthlakeFY26AdoptedBudget
P. 107
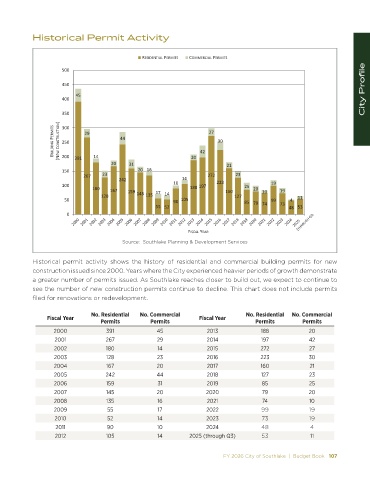
Historical Permit Activity


                                                Z ^/  Ed/ > W ZD/d^   KDD Z / > W ZD/d^
                                                                                                                          City Profile
                      ϱϬϬ

                      ϰϱϬ
                          ϰϱ
                      ϰϬϬ

                      ϯϱϬ

                    h/> /E' W ZD/d^  ;E t  KE^dZh d/KEͿ  ϯϬϬ  Ϯϵ  ϰϰ  ϰϮ  Ϯϳ  ϯϬ

                      ϮϱϬ

                                ϭϰ
                      ϮϬϬ
                          ϯϵϭ
                                      ϮϬ    ϯϭ                  ϮϬ          Ϯϭ
                      ϭϱϬ                      ϮϬ ϭϲ
                             Ϯϲϳ   Ϯϯ                                 ϮϳϮ      Ϯϯ
                                        ϮϰϮ                  ϭϰ          ϮϮϯ
                      ϭϬϬ                                 ϭϬ       ϭϵϳ            Ϯϱ       ϭϵ
                                ϭϴϬ  ϭϲϳ   ϭϱϵ                  ϭϴϴ         ϭϲϬ      ϮϬ  ϭϬ   ϭϵ
                                  ϭϮϴ         ϭϰϱ  ϭϯϱ  ϭϳ  ϭϰ                 ϭϮϳ                  ϭϭ
                      ϱϬ                                  ϵϬ  ϭϬϱ                 ϴϱ ϳϵ ϳϰ  ϵϵ   ϰ
                                                     ϱϱ ϱϮ                                    ϳϯ  ϰϴ ϱϯ
                       Ϭ

                                                               &/^  > z  Z
                                         Source:  Southlake Planning & Development Services


            Historical permit activity shows the history of residential and commercial building permits for new
            construction issued since 2000. Years where the City experienced heavier periods of growth demonstrate
            a greater number of permits issued. As Southlake reaches closer to build out, we expect to continue to
            see the number of new construction permits continue to decline. This chart does not include permits
            filed for renovations or redevelopment.

                               No. Residential   No. Commercial                   No. Residential   No. Commercial
                 Fiscal Year                                       Fiscal Year
                                  Permits          Permits                           Permits         Permits
                   2000             391              45              2013              188             20
                   2001             267              29              2014              197             42
                   2002             180              14              2015              272             27
                   2003             128              23              2016              223             30
                   2004             167              20              2017              160             21
                   2005             242              44              2018              127             23
                   2006             159              31              2019               85             25
                   2007             145              20              2020               79             20
                   2008             135              16              2021               74             10
                   2009              55              17              2022              99              19
                   2010              52              14              2023               73             19
                   2011             90               10              2024              48               4
                   2012             105              14         2025 (through Q3)       53              11


                                                                           FY 2026 City of Southlake  |  Budget Book   107