
Page 119 - CityofSouthlakeFY26AdoptedBudget
P. 119
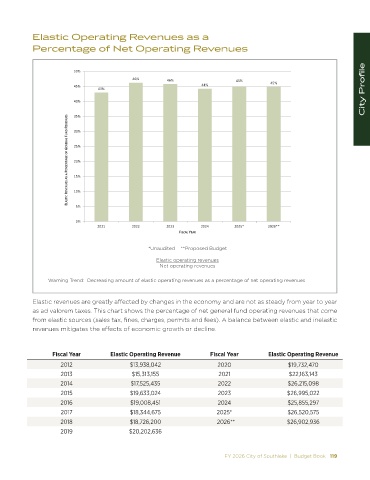
Elastic Operating Revenues as a

            Percentage of Net Operating Revenues


                                                                                                                          City Profile
                         ϱϬй
                                             ϰϲй        ϰϲй                    ϰϱй
                         ϰϱй                                        ϰϰй                    ϰϱй
                                 ϰϯй
                         ϰϬй

                         ϯϱй
                        > ^d/  Z s Eh ^  ^   W Z  Ed '  K& ' E Z > &hE  Z s Eh ^  ϯϬй


                         Ϯϱй

                         ϮϬй

                         ϭϱй

                         ϭϬй

                          ϱй

                          Ϭй
                                 ϮϬϮϭ        ϮϬϮϮ       ϮϬϮϯ       ϮϬϮϰ        ϮϬϮϱΎ      ϮϬϮϲΎΎ
                                                            &/^  > z  Z

                                                  *Unaudited    **Proposed Budget
                                                     Elastic operating revenues
                                                      Net operating revenues

                 Warning Trend:  Decreasing amount of elastic operating revenues as a percentage of net operating revenues


            Elastic revenues are greatly affected by changes in the economy and are not as steady from year to year
            as ad valorem taxes. This chart shows the percentage of net general fund operating revenues that come
            from elastic sources (sales tax, fines, charges, permits and fees). A balance between elastic and inelastic
            revenues mitigates the effects of economic growth or decline.


                  Fiscal Year         Elastic Operating Revenue        Fiscal Year        Elastic Operating Revenue
                     2012                   $13,938,042                  2020                   $19,732,470
                     2013                    $15,313,155                 2021                    $22,163,143
                     2014                   $17,525,435                  2022                   $26,215,098
                     2015                   $19,633,024                  2023                   $26,995,022
                     2016                   $19,008,451                  2024                   $25,855,297
                     2017                   $18,344,675                  2025*                  $26,520,575
                     2018                   $18,726,200                   2026**                $26,902,936
                     2019                   $20,202,636


                                                                           FY 2026 City of Southlake  |  Budget Book   119