
Page 120 - CityofSouthlakeFY26AdoptedBudget
P. 120
Budgeted vs. Actual Revenue (General Fund)
ϭϭϱй
ϭϭϬй ϭϭϭй
ϭϬϳй
ϭϬϱй
ϭϬϱй
ϭϬϰй
ϭϬϰй
City Profile
W Z Ed ' K& h ' d Z s Eh K>> d ϵϱй
ϭϬϬй
ϵϬй
ϴϱй
ϴϬй
ϳϱй
ϮϬϮϬ ϮϬϮϭ ϮϬϮϮ ϮϬϮϯ ϮϬϮϰ
&/^ > z Z
Revenue shortfalls or surpluses
Net operating revenues
Warning Trend: Increase in revenue shortfalls or surpluses as a percentage of actual net operating revenues
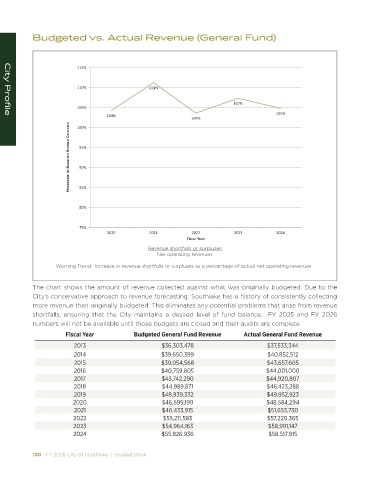
The chart shows the amount of revenue collected against what was originally budgeted. Due to the
City’s conservative approach to revenue forecasting, Southlake has a history of consistently collecting
more revenue than originally budgeted. This eliminates any potential problems that arise from revenue
shortfalls, ensuring that the City maintains a desired level of fund balance. FY 2025 and FY 2026
numbers will not be available until those budgets are closed and their audits are complete.
Fiscal Year Budgeted General Fund Revenue Actual General Fund Revenue
2013 $36,303,478 $37,533,344
2014 $39,650,399 $40,852,512
2015 $39,054,568 $43,657,605
2016 $40,759,805 $44,001,000
2017 $43,742,290 $44,920,807
2018 $44,989,871 $46,423,288
2019 $48,939,332 $49,952,923
2020 $46,599,199 $48,584,294
2021 $46,433,915 $51,653,730
2022 $55,211,583 $57,220,365
2023 $54,964,163 $58,991,147
2024 $55,826,936 $58,517,915
120 FY 2026 City of Southlake | Budget Book FY 2026 City of Southlake | Budget Book 121