
Page 121 - CityofSouthlakeFY26AdoptedBudget
P. 121
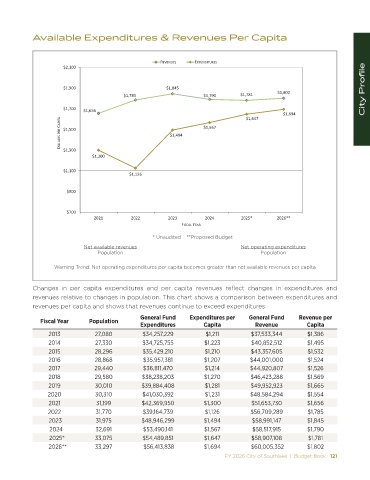
Available Expenditures & Revenues Per Capita


                                                      Z s Eh ^    yW E /dhZ ^
                      ΨϮ͕ϭϬϬ


                      Ψϭ͕ϵϬϬ                            Ψϭ͕ϴϰϱ                                                            City Profile
                                          Ψϭ͕ϳϴϱ                    Ψϭ͕ϳϵϬ       Ψϭ͕ϳϴϭ      Ψϭ͕ϴϬϮ

                      Ψϭ͕ϳϬϬ  Ψϭ͕ϲϱϲ
                                                                                               Ψϭ͕ϲϵϰ
                                                                                  Ψϭ͕ϲϰϳ
                      K>> Z^ W Z   W/d   Ψϭ͕ϱϬϬ          Ψϭ͕ϰϵϰ     Ψϭ͕ϱϲϳ


                      Ψϭ͕ϯϬϬ
                                Ψϭ͕ϯϬϬ
                      Ψϭ͕ϭϬϬ
                                            Ψϭ͕ϭϮϲ


                       ΨϵϬϬ


                       ΨϳϬϬ
                                ϮϬϮϭ        ϮϬϮϮ         ϮϬϮϯ        ϮϬϮϰ        ϮϬϮϱΎ       ϮϬϮϲΎΎ
                                                             &/^  > z  Z
                                                    * Unaudited    **Proposed Budget
                             Net available revenues                              Net operating expenditures
                                 Population                                            Population
                   Warning Trend: Net operating expenditures per capita becomes greater than net available revenues per capita


            Changes  in per  capita expenditures and  per capita  revenues reflect changes  in  expenditures and
            revenues relative to changes in population. This chart shows a comparison between expenditures and
            revenues per capita and shows that revenues continue to exceed expenditures.

                                               General Fund     Expenditures per   General Fund     Revenue per
              Fiscal Year     Population
                                               Expenditures         Capita           Revenue           Capita
                 2013           27,080          $34,257,229          $1,211         $37,533,344        $1,386
                 2014            27,330         $34,725,755          $1,223         $40,852,512        $1,495
                 2015           28,296          $35,429,210          $1,210         $43,357,605        $1,532
                 2016           28,868          $35,957,381          $1,207         $44,001,000        $1,524
                 2017           29,440          $36,811,470          $1,214         $44,920,807        $1,526
                 2018           29,580          $38,238,203          $1,270         $46,423,288        $1,569
                 2019           30,010          $39,884,408          $1,281         $49,952,923        $1,665
                 2020            30,310         $41,030,392          $1,231         $48,584,294        $1,554
                 2021            31,199         $42,369,950         $1,300          $51,653,730        $1,656
                 2022            31,770         $39,164,739          $1,126         $56,709,289        $1,785
                  2023           31,975         $48,946,299         $1,494          $58,991,147        $1,845
                  2024           32,691         $53,490,141          $1,567          $58,517,915       $1,790
                   2025*        33,075          $54,489,851          $1,647         $58,907,108        $1,781
                   2026**       33,297           $56,413,838         $1,694          $60,005,352       $1,802
                                                                           FY 2026 City of Southlake  |  Budget Book   121