
Page 495 - Microsoft Word - FY 2022 Adopted Budget Document
P. 495
Return to Table of Contents
147.5% $228,455 25% 10,703 100% $936,767 $629,464 67% 17.3% $1,121 1.46% 1.6% 9% Affirm 100% 12% 40% 104 days 100% 98% 48 $3,094 46% 1.4% 0.1% 0.6% 77% 86% 79 0.003 33 150 4,310 8 $425,645 61,576 1 0% 49 17% 149 1 0 2 0 13% 0 0
Sept.
127.41% $225,455 30% 88% 117% 9,130 100% $1,020,657 $680,764 67% Affirm 100% 100% 99% 74 $3,337 0.8% 0.1% 0.1% 78% 141 0.000 16 1,507 3,282 7 $317,124 60,014 1 10% 59 17% 176 3 1 19 0 24% 0 1
Aug.
75.1% $215,717 60% 81% 111% 8,594 100% $956,445 $653,364 68% Affirm 100% 5 stars 100% 100% 48 $4,467 1.3% 0.3% 0.0% 78% 77 0.000 33 791 3,223 10 $290,577 84,271 2 84% 47 17% 174 2 0 0 0 55% 0 2
July
71.9% $106,496 35% 78% 116% 8,609 100% $951,801 $656,164 69% 17.3% $1,121 1.46% 5% Affirm 100% 12% 100% 99% 18 $1,282 1.3% 0.1% 0.0% 77% 24 0.001 22 7,099 2,272 8 63,320 4 41% 75 16% 174 3 0 0 5 43% 1 4
June $872,166
71.18% $92,581 9% 75% 112% 7,209 100% $979,657 $691,832 71% Yes 100% 100% 90% 20 $3,850 1.2% 0.3% 0.9% 77% 12 0.003 36 1,370 11,466 10 $515,347 50,569 2 73% 41 16% 174 2 1 0 0 19% 0 1
May
331.41% $80,808 40% 74% 114% 7,606 100% $1,206,724 $850,287 70% 100% 100% 100% 25 $4,596 1.3% 0.1% 0.0% 76% 17 0.001 27 562 3,354 7 42,043 3 42% 50 15.34% 174 2 0 0 5 34% 1 2
April $8,107,087
46.87% $60,351 0% 71% 111% 9,284 100% 74% 16.95% $1,139 1.52% 5% Yes 100% 14% 100% 100% 22 $2,951 0.9% 0% 0.4% 76% 89 0.001 22 1,340 9,555 6 $601,366 46,504 2 0% 39 15% 174 3 2 0 0 10% 0 0
Mar. $1,667,968 $1,233,155
89.53% $50,386 0% 72% 109% 4,396 100% $789,623 $535,223 68% 100% 100% 97% 33 $11,739 0.9% 0% 0.1% 75% 64 0.000 19 1,015 15,451 9 $794,796 42,215 1 0% 42 15% 172 1 0 0 0 7% 0 0
Feb.
86.49% $10,266 145% 72% 108% 6,865 100% $865,413 $589,044 68% 100% 100% 97% 45 $3,137 0.8% 0% 0.3% 74% 47 0.000 24 0 6,091 4 $932,526 30,233 0 0% 32 15% 172 0 0 0 0 1% 0 0
Jan.
95.73% $10,266 0% 74% 108% 7,480 100% $828,334 $550,539 66% 17.94% $1,068 1.39% $3,167,592 5% 100% 100% 96% 111 $4,868 1.2% 0% 0.3% 74% 92 0.001 44 0 31,160 9 92,181 0 0% 23 15% 172 0 1 0 0 2% 0 0
Dec. $17,903,157
60.47% $10,266 1% 74% 108% 8,778 100% $894,798 $591,744 66% 100% 100% 95% 72 $2,607 1.1% 0% 0.4% 74% 127 0.0 25 0 10,123 2 47,902 0 0% 17 15% 171 3 1 11 5 8% 0 0
Nov. $3,629,968
649.44% $5,289 23% 73% 106% 8,761 100% $982,100 $651,067 66% 100% 100% 95% 45 $5,004 1.6% 0% 0.4% 73% 103 0.0 15 1,191 22,705 8 $7,269,108 46,711 2 0% 22 15% 168 0 1 0 0 17% 1 3
Oct.
FY 2021 Actual 111.46% $228,455 29% 88% 117% 97,415 100% $12,080,287 $8,312,647 69% 17.3% $1,121 1.46% 1.6% $3,167,592 9% Yes Yes Affirm 100% 5 Stars 12% 40% 104 days 100% 97% 567 $4,224 46% 13.8% 1% 3.5% 76% 86% 653 0.010 316 15,025 122,992 88 $41,658,867 648,347 18 34% 496 17% 149 18 8 32 2.5 20% 3 13
FY 2021 4th Qtr. Actual 116.68% $228,455 38% 88% 117% 28,427 100% $2,913,869 $1,963,592 67% 17.3% $1,121 1.46% 1.6% 9% 100% 12% 40% 104 days 100% 99% 170 $3,588 46% 3.5% 0.5% 0.7% 77% 86% 297 0.003 82 2,448 10,815 25 $1,033,346 205,861 4 31% 155 17% 149 6 1 21 0 31% 0 3
FY 2021 3rd Qtr. Actual 158.2% $106,496 25% 78% 116% 22,589 100% $3,138,182 $2,198,283 70% 17.3% $1,121 1.46% 5% Yes Affirm 100% 12% 100% 96% 63 $3,412 3.8% 0.5% 0.9% 76% 53 0.005 85 9,031 17,092 25 $9,494,600 155,932 9 52% 166 15.78% 174 7 1 0 5 32% 2 7
74.3% $60,351 49% 71% 111% 20,031 100% 69% 16.95% $1,139 1.52% 5% Yes 100% 14% 100% 98% 100 $5,935 2.6% 0% 0.8% 75% 199 0.001 65 2,355 31,097 19 118,952 3 0% 113 15% 174 4 2 0 0 6% 0 0
FY 2021 2nd Qtr. Actual $6,028,236 $4,150,772 $2,328,688
FY 2021 1st Qtr. Actual 268.54% $10,266 6% 74% 108% 25,019 100% $2,705,232 $1,793,350 66% 17.94% $1,068 1.39% $3,167,592 5% 100% 100% 95% 228 $4,181 3.9% 0% 1.1% 74% 322 0.001 84 1,191 63,988 19 $28,802,233 186,794 2 9% 62 15% 190 3 3 11 5 9% 1 3
FY 2021 Annual Target 100% $50,000 75% 78% 100% 82,000 95% $15,031,039 $9,009,370 68% < 20% $1,245 < 2% 0.6% $3,100,000 6% Yes Yes Yes Affirm 100% 5 Stars 30% 20% < 90 days 100% 95% 351 $3,508 60% 8% 2% 3% 75% 90% 2,400 ≤ 2 280 10,000 87,000 150 $9,500,000 550,000 20 50% 425 26% 180 64 64 45 4.8 52% 12 55
FY 2020 Actual 113.07% 10% 73% 85% 90,204 100% $14,456,446 $10,534,625 73% 16.95% $1,139 1.52% 0.35% $3,121,092 13% Yes Yes Yes Affirm 100% 5 Stars 25% 20% 85 days 100% 98% 442 $2,468 48% 8% 1% 4% 74% 91% 2,424 0.012 417 14,866 77,429 59 $26,129,564 573,098 17 32% 608 21% 168 23 16 16 4.7 24% 6 27
110% 51% 75% 86% 79,753 100% 69% 16.9% $1,110 1.47% 0.5% 10% Yes Yes Yes Affirm 100% 5 Stars 15% 100% 97% 335 $6,161 50% 9.9% 3% 3.4% 74% 89% 3,865 0.01 342 21,973 100,117 108 691,256 34 42% 744 26% 184 35 12 67 4.7 50% 13 76
FY 2019 FY 2018 Actual Actual 106.7% New Measure in FY 2021 81% 78% 81% 73,547 100% $17,001,555 $16,401,847 $11,813,005 $10,775,588 66% 16% $1,064 1.74% 0.47% $2,682,648 $2,683,011 21% Yes Yes Yes Affirm & Upgrade 100% 5 Stars 19% New Measure in FY 2020 New Measure in FY 2020 100% 99% 361 $2,945 52% 8.9% 2% 3% 75% 88% 2,336 0.01 345 14,782 82,005 91 $28,464,325 $23,329,424 749,703 29 51% 457 30% 178 57 78
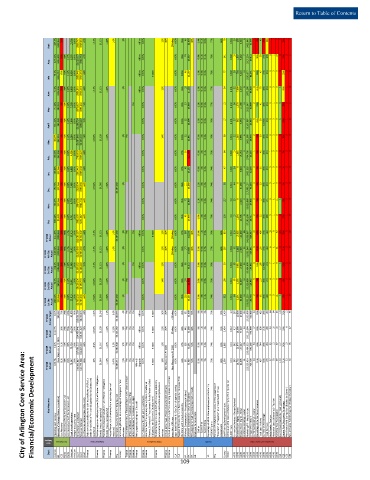
City of Arlington Core Service Area:
Financial/Economic Development Key Measures Operating cost recovery Recovery of Damage Claims [cumulative] Cost Recovery Cost recovery of Parks Performance Fund Cost recovery of Golf Performance Fund Total aircraft operations Hangar occupancy rate Gross Revenue collected Revenue Retained % of revenue retained (less state costs) Debt service expenditures to total expenditures of GF plus Debt Service (Net of Pension Obligation Bonds) [measured quarterly] Net tax‐sup
Category
Budgetary Issues
Policy Compliance
Cost Recovery
Goal
Aviation
Aviation
Aviation
Finance
Finance
Finance
Finance
Finance
Finance
Dept.
Finance
Finance
Finance
Finance
Finance
Finance
Finance
Library
Parks
Parks
Court
Court
Court
CLA
Fire
CLA
CES
HR
ED
109 HR HR HR HR Benefits Fire Library Water ACVB ACVB ACVB ACVB ACVB ACVB ACVB ACVB ACVB ACVB ACVB ACVB Convention and Tourism Sales ACVB ACVB CES CES CES CES