
Page 167 - Manfield FY21 Budget
P. 167
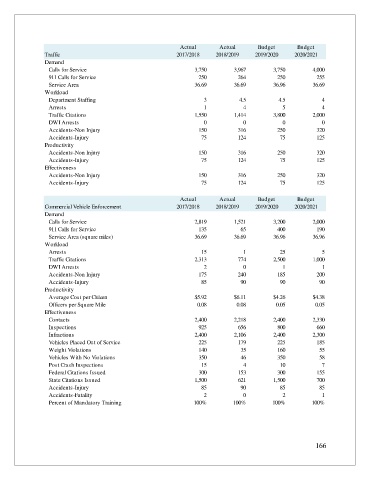
Actual       Actual      Budget       Budget
                Traffic                                    2017/2018    2018/2019    2019/2020    2020/2021
                Demand
                 Calls for Service                               3,750        3,967        3,750        4,000
                 911 Calls for Service                             250          264          250          255
                 Service Area                                    36.69        36.69        36.96        36.69
                Workload
                 Department Staffing                                3           4.5          4.5            4
                 Arrests                                            1             4            5            4
                 Traffic Citations                               1,550        1,414        3,800        2,000
                 DWI Arrests                                        0             0            0            0
                 Accidents-Non Injury                              150          316          250          320
                 Accidents-Injury                                   75          124           75          125
                Productivity
                 Accidents-Non Injury                              150          316          250          320
                 Accidents-Injury                                   75          124           75          125
                Effectiveness
                 Accidents-Non Injury                              150          316          250          320
                 Accidents-Injury                                   75          124           75          125

                                                             Actual       Actual      Budget       Budget
                Commercial Vehicle Enforcement             2017/2018    2018/2019    2019/2020    2020/2021
                Demand
                 Calls for Service                                          2,819                    1,521                    3,200                    2,000
                 911 Calls for Service                             135           65          400          190
                 Service Area (square miles)                     36.69        36.69        36.96        36.96
                Workload
                 Arrests                                            15            1           25            5
                 Traffic Citations                                          2,313                       774                    2,500                    1,000
                 DWI Arrests                                        2             0            1            1
                 Accidents-Non Injury                              175          240          185          200
                 Accidents-Injury                                   85           90           90           90
                Productivity
                 Average Cost per Citizen                        $5.92        $6.11        $4.26        $4.38
                 Officers per Square Mile                         0.08         0.08         0.05         0.05
                Effectiveness
                 Contacts                                                   2,400                    2,218                    2,400                    2,330
                 Inspections                                                   925                       656                       800                       660
                 Infractions                                                2,400                    2,106                    2,400                    2,300
                 Vehicles Placed Out of Service                                225                       179                       225                       185
                 Weight Violations                                             140                         35                       160                         55
                 Vehicles With No Violations                                   350                         46                       350                         58
                 Post Crash Inspections                                          15                           4                         10                           7
                 Federal Citations Issued                                      300                       153                       300                       155
                 State Citations Issued                                     1,500                       621                    1,500                       700
                 Accidents-Injury                                   85           90           85           85
                 Accidents-Fatality                                 2             0            2            1
                 Percent of Mandatory Training                   100%         100%         100%         100%


                                                                                                         166