
Page 165 - Manfield FY21 Budget
P. 165
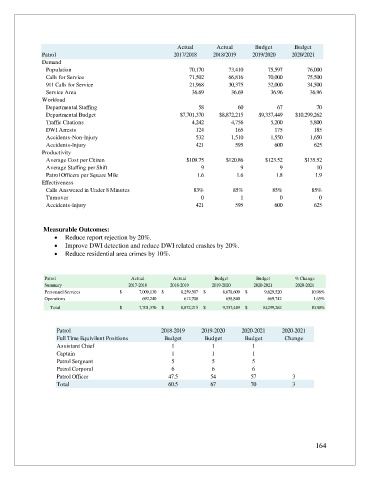
Actual       Actual      Budget       Budget
               Patrol                                      2017/2018    2018/2019    2019/2020    2020/2021
               Demand
                Population                                      70,170       73,410       75,597       76,000
                Calls for Service                               71,502       66,816       70,000       75,500
                911 Calls for Service                           21,968       30,375       32,000       34,500
                Service Area                                     36.69        36.69        36.96        36.96
               Workload
                Departmental Staffing                              58           60           67           70
                Departmental Budget                          $7,701,370   $8,872,215   $9,337,449   $10,299,262
                Traffic Citations                                          4,242                    4,756                    5,200   5,800
                DWI Arrests                                       124          165          175          185
                Accidents-Non-Injury                              532                   1,510                    1,550   1,650
                Accidents-Injury                                  421          595          600          625
               Productivity
                Average Cost per Citizen                       $109.75      $120.86      $123.52      $135.52
                Average Staffing per Shift                          9            9            9           10
                Patrol Officers per Square Mile                   1.6          1.6          1.8          1.9
               Effectiveness
                Calls Answered in Under 8 Minutes                83%          85%          85%          85%
                Turnover                                            0            1            0            0
                Accidents-Injury                                  421          595          600          625


               Measurable Outcomes:
                   •  Reduce report rejection by 20%.
                   •  Improve DWI detection and reduce DWI related crashes by 20%.
                   •  Reduce residential area crimes by 10%.


                Patrol                      Actual        Actual        Budget        Budget       % Change
                Summary                     2017-2018    2018-2019     2019-2020     2020-2021     2020-2021

                Personnel Services       $                   7,009,130  $                   8,259,507  $                   8,678,609  $                 9,629,520  10.96%
                Operations                                     692,240                        612,708                        658,840                          669,742  1.65%


                  Total                  $                 7,701,370  $                   8,872,215  $                 9,337,449  $                 10,299,262  10.30%


                    Patrol                            2018-2019     2019-2020    2020-2021    2020-2021
                    Full Time Equivilent Positions     Budget        Budget       Budget       Change
                    Assistant Chief                       1            1            1
                    Captain                               1            1            1
                    Patrol Sergeant                       5            5            5
                    Patrol Corporal                       6            6            6
                    Patrol Officer                       47.5          54           57            3
                    Total                                60.5          67           70            3


                                                                                                         164