
Page 134 - Manfield FY21 Budget
P. 134
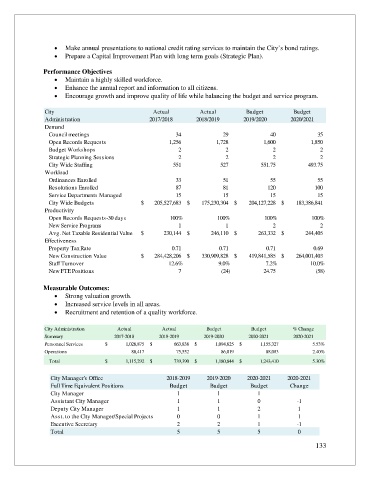
•  Make annual presentations to national credit rating services to maintain the City’s bond ratings.
                   •  Prepare a Capital Improvement Plan with long term goals (Strategic Plan).

               Performance Objectives
                   •  Maintain a highly skilled workforce.
                   •  Enhance the annual report and information to all citizens.
                   •  Encourage growth and improve quality of life while balancing the budget and service program.

                City                                Actual         Actual         Budget          Budget
                Administration                    2017/2018       2018/2019       2019/2020      2020/2021
                Demand
                 Council meetings                                          34                              29                              40                              35

                 Open Records Requests                                  1,256                         1,728                         1,600                         1,850
                 Budget Workshops                                              2                                2                                2                                2
                 Strategic Planning Sessions                                   2                                2                                2                                2
                 City Wide Staffing                                      551                            527                       551.75                       493.75

                Workload
                 Ordinances Enrolled                                         33                              51                              55                              55
                 Resolutions Enrolled                                      87                              81                            120                            100

                 Service Departments Managed                               15                              15                              15                              15

                 City Wide Budgets              $         205,527,683 $           175,230,304 $           204,127,228 $           183,386,841

                Productivity
                 Open Records Requests-30 days           100%            100%            100%           100%
                 New Service Programs                       1               1              2               2
                 Avg. Net Taxable Residential Value  $                  230,144 $                  246,110 $                  263,332 $                  244,405
                Effectiveness
                 Property Tax Rate                                        0.71                           0.71                           0.71                           0.69
                 New Construction Value         $           284,428,206 $           330,909,828 $           419,841,585 $           264,001,403
                 Staff Turnover                          12.6%           9.0%            7.2%           10.0%

                 New FTE Positions                                           7                            (24)                         24.75                            (58)


               Measurable Outcomes:
                   •  Strong valuation growth.
                   •  Increased service levels in all areas.
                   •  Recruitment and retention of a quality workforce.

                City Administration     Actual         Actual        Budget         Budget        % Change
                Summary                2017-2018      2018-2019     2019-2020      2020-2021      2020-2021


                Personnel Services  $                   1,026,875  $                      663,838  $                 1,094,825  $                 1,155,327  5.53%


                Operations                                  88,417                          75,552                          86,019                            88,083  2.40%

                 Total              $                   1,115,292  $                      739,390  $                 1,180,844  $                   1,243,410  5.30%

                  City Manager's Office                 2018-2019    2019-2020     2020-2021    2020-2021
                  Full Time Equivalent Positions         Budget        Budget       Budget       Change
                  City Manager                              1            1            1
                  Assistant City Manager                    1            1            0            -1
                  Deputy City Manager                       1            1            2             1
                  Asst. to the City Manager/Special Projects  0          0            1             1
                  Executive Secretary                       2            2            1            -1
                  Total                                     5            5            5             0

                                                                                                         133