Page 99 - Southlake FY20 Budget
P. 99

City Profile


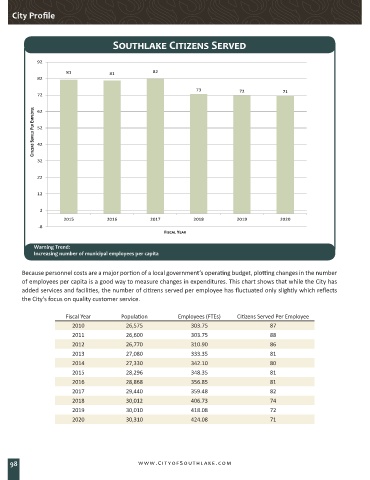
                                      Southlake Citizens Served


             92
                       81            81             82
             82
                                                                  73            72             71
             72

            CITIZENS SERVED PER EMPLOYEE  52
             62


             42


             32

             22

             12


              2
                      2015          2016           2017          2018          2019           2020
              -8
                                                       FISCAL YEAR
            Warning Trend:
            Increasing number of municipal employees per capita

        Because personnel costs are a major portion of a local government’s operating budget, plotting changes in the number
        of employees per capita is a good way to measure changes in expenditures. This chart shows that while the City has
        added services and facilities, the number of citizens served per employee has fluctuated only slightly which reflects
        the City’s focus on quality customer service.

                       Fiscal Year       Population         Employees (FTEs)   Citizens Served Per Employee
                         2010              26,575               303.75                    87
                         2011              26,600               303.75                    88
                         2012              26,770               310.90                    86
                         2013              27,080               333.35                    81
                         2014              27,330               342.10                    80
                         2015              28,296               348.35                    81
                         2016              28,868               356.85                    81
                         2017              29,440               359.48                    82
                         2018              30,012               406.73                    74
                         2019              30,010               418.08                    72
                         2020              30,310               424.08                    71


    98                                         www.CityofSouthlake.com
   94   95   96   97   98   99   100   101   102   103   104