Page 96 - Southlake FY20 Budget
P. 96

City Profile


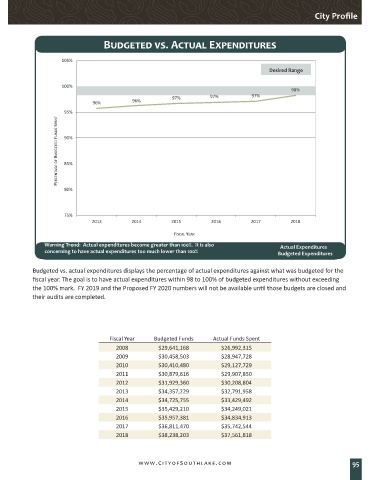
                                   Budgeted vs. Actual Expenditures


                     105%
                                                                                          Desired Range

                     100%
                                                                                                 98%
                                                          97%          97%          97%
                                96%          96%
                      95%
                    PERCENTAGE OF BUDGETED FUNDS SPENT  90%


                      85%


                      80%


                      75%
                               2013          2014         2015         2016         2017         2018

                                                           FISCAL YEAR
                Warning Trend:  Actual expenditures become greater than 100%.  It is also       Actual Expenditures
                concerning to have actual expenditures too much lower than 100%      *Unaudited      **Proposed Budget*Unaudited      **Proposed Budget
                                                                                              Budgeted Expenditures

            Budgeted vs. actual expenditures displays the percentage of actual expenditures against what was budgeted for the
            fiscal year. The goal is to have actual expenditures within 98 to 100% of budgeted expenditures without exceeding
            the 100% mark.  FY 2019 and the Proposed FY 2020 numbers will not be available until those budgets are closed and
            their audits are completed.


                                     Fiscal Year    Budgeted Funds     Actual Funds Spent
                                       2008          $29,641,168          $26,992,315
                                       2009          $30,458,503          $28,947,728
                                       2010          $30,410,480          $29,127,729
                                       2011          $30,879,616          $29,907,850
                                       2012          $31,929,360          $30,208,804
                                       2013          $34,357,229          $32,791,958
                                       2014          $34,725,755          $33,429,492
                                       2015          $35,429,210          $34,249,021
                                       2016          $35,957,381          $34,834,913
                                       2017          $36,811,470          $35,742,544
                                       2018          $38,238,203          $37,561,818


                                               www.CityofSouthlake.com                                                95
   91   92   93   94   95   96   97   98   99   100   101