Page 94 - Southlake FY20 Budget
P. 94

City Profile


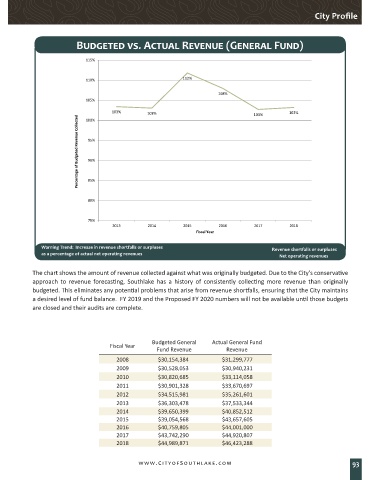
                          Budgeted vs. Actual Revenue (General Fund)


                             115%


                             110%                            112%

                                                                         108%
                             105%
                                      103%        103%                               103%        103%
                           Percentage of Budgeted Revenue Collected   95%
                             100%


                              90%


                              85%


                              80%


                              75%
                                      2013        2014        2015       2016        2017        2018
                                                                  Fiscal Year

               Warning Trend:  Increase in revenue shortfalls or surpluses                 Revenue shortfalls or surpluses
               as a percentage of actual net operating revenues                                   Net operating revenues

            The chart shows the amount of revenue collected against what was originally budgeted. Due to the City’s conservative
            approach  to  revenue  forecasting,  Southlake  has  a  history  of  consistently  collecting  more  revenue  than  originally
            budgeted. This eliminates any potential problems that arise from revenue shortfalls, ensuring that the City maintains
            a desired level of fund balance.  FY 2019 and the Proposed FY 2020 numbers will not be available until those budgets
            are closed and their audits are complete.


                                                   Budgeted General    Actual General Fund
                                     Fiscal Year
                                                     Fund Revenue           Revenue
                                        2008         $30,154,384          $31,299,777
                                        2009         $30,528,053          $30,940,231
                                        2010         $30,820,685          $33,114,058
                                        2011          $30,901,328          $33,670,697
                                        2012          $34,515,981          $35,261,601
                                        2013         $36,303,478          $37,533,344
                                        2014         $39,650,399          $40,852,512
                                        2015         $39,054,568          $43,657,605
                                        2016          $40,759,805          $44,001,000
                                        2017          $43,742,290          $44,920,807
                                        2018          $44,989,871          $46,423,288


                                               www.CityofSouthlake.com                                                93
   89   90   91   92   93   94   95   96   97   98   99