
Page 92 - Southlake FY20 Budget
P. 92
City Profile
Sales Tax Revenue Analysis
CRIME CONTROL & PREVENTION DISTRICT SOUTHLAKE PARKS DEVELOPMENT CORPORATION
COMMUNITY ENHANCEMENT & DEVELOPMENT CORPORATION GENERAL FUND
$35,000,000
$30,000,000
$25,000,000
$14,339,915 $13,732,007 $14,111,661 $14,700,000 $15,000,000
$13,480,025
$20,000,000
DOLLARS
$15,000,000
$5,421,104 $5,613,663 $5,707,414 $5,650,340 $5,650,340
$7,440,726
$10,000,000
$5,000,000 $7,318,490 $7,578,446 $7,705,009 $7,650,000 $7,650,000
$7,335,505
$1,803,605 $1,879,292 $1,923,567 $1,881,000 $1,881,000
$-
2015 2016 2017 2018 2019* 2020**
FISCAL YEAR
Warning Trend: *Unaudited
Decreasing sales tax collection 2015-2020 **Proposed Budget
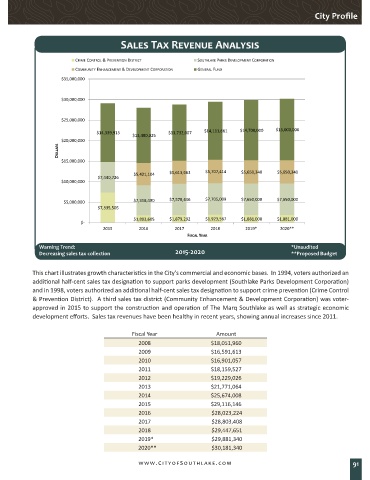
This chart illustrates growth characteristics in the City’s commercial and economic bases. In 1994, voters authorized an
additional half-cent sales tax designation to support parks development (Southlake Parks Development Corporation)
and in 1998, voters authorized an additional half-cent sales tax designation to support crime prevention (Crime Control
& Prevention District). A third sales tax district (Community Enhancement & Development Corporation) was voter-
approved in 2015 to support the construction and operation of The Marq Southlake as well as strategic economic
development efforts. Sales tax revenues have been healthy in recent years, showing annual increases since 2011.
Fiscal Year Amount
2008 $18,051,960
2009 $16,591,613
2010 $16,901,057
2011 $18,159,527
2012 $19,229,026
2013 $21,771,064
2014 $25,674,008
2015 $29,116,146
2016 $28,023,224
2017 $28,803,408
2018 $29,447,651
2019* $29,881,340
2020** $30,181,340
www.CityofSouthlake.com 91