
Page 87 - Southlake FY20 Budget
P. 87
City Profile
Retail Occupancy Rate
RETAIL OCCUPANCY RATE - SOUTHLAKE RETAIL OCCUPANCY RATE - DFW MARKET
96.0%
95.3% 95.5% 95.5%
94.9%
95.0%
95.2%
94.1% 94.1% 94.1%
94.0% 93.9% 93.9%
93.3%
92.8% 93.6% 92.8%
93.0%
92.1%
92.0% 92.4%
91.5% 91.3%
91.1%
91.0%
91.0%
90.6%
90.0%
89.9%
89.0%
88.0%
87.0%
2009 2010 2011 2012 2013 2014 2015 2016 2017 2018 2019
(THROUGH
Q2)
CALENDAR YEAR
Warning Trend:
Decreasing occupancy rates Calendar Year
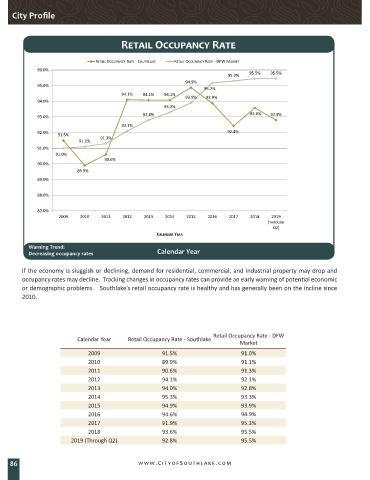
If the economy is sluggish or declining, demand for residential, commercial, and industrial property may drop and
occupancy rates may decline. Tracking changes in occupancy rates can provide an early warning of potential economic
or demographic problems. Southlake’s retail occupancy rate is healthy and has generally been on the incline since
2010.
Retail Occupancy Rate - DFW
Calendar Year Retail Occupancy Rate - Southlake
Market
2009 91.5% 91.0%
2010 89.9% 91.1%
2011 90.6% 91.3%
2012 94.1% 92.1%
2013 94.0% 92.8%
2014 95.3% 93.3%
2015 94.9% 93.9%
2016 94.6% 94.9%
2017 91.9% 95.3%
2018 93.6% 95.5%
2019 (Through Q2) 92.8% 95.5%
86 www.CityofSouthlake.com