Page 82 - Southlake FY20 Budget
P. 82

City Profile


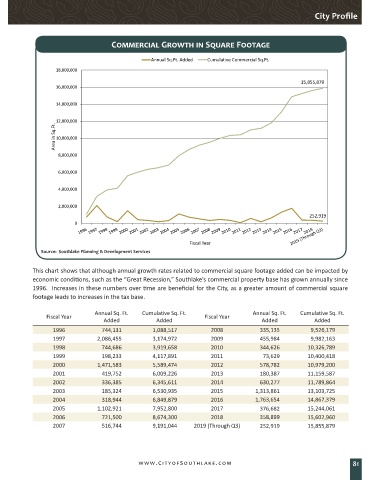
                                      Commercial Growth in Square Footage


                                                   Annual Sq.Ft. Added  Cumulative Commercial Sq.Ft.
                    18,000,000
                                                                                                     15,855,879
                    16,000,000


                    14,000,000

                    12,000,000
                   Area in Sq.Ft.  10,000,000


                    8,000,000


                    6,000,000

                    4,000,000


                    2,000,000
                                                                                                       252,919
                          0


                                                                Fiscal Year
               Source:  Southlake Planning & Development Services


            This chart shows that although annual growth rates related to commercial square footage added can be impacted by
            economic conditions, such as the “Great Recession,” Southlake’s commercial property base has grown annually since
            1996.  Increases in these numbers over time are beneficial for the City, as a greater amount of commercial square
            footage leads to increases in the tax base.


                                Annual Sq. Ft.    Cumulative Sq. Ft.                 Annual Sq. Ft.    Cumulative Sq. Ft.
                Fiscal Year                                          Fiscal Year
                                   Added             Added                              Added            Added
                   1996            744,131          1,088,517          2008             335,135         9,526,179
                   1997          2,086,455          3,174,972          2009             455,984         9,982,163
                   1998            744,686          3,919,658          2010             344,626        10,326,789
                   1999            198,233          4,117,891          2011              73,629        10,400,418
                   2000          1,471,583          5,589,474          2012             578,782        10,979,200
                   2001            419,752          6,009,226          2013             180,387        11,159,587
                   2002            336,385          6,345,611          2014             630,277        11,789,864
                   2003            185,324          6,530,935          2015          1,313,861         13,103,725
                   2004            318,944          6,849,879          2016          1,763,654         14,867,379
                   2005           1,102,921         7,952,800          2017            376,682         15,244,061
                   2006            721,500          8,674,300          2018            358,899         15,602,960
                   2007            516,744          9,191,044    2019 (Through Q3)     252,919         15,855,879


                                               www.CityofSouthlake.com                                                81
   77   78   79   80   81   82   83   84   85   86   87