Page 84 - Southlake FY20 Budget
P. 84

City Profile


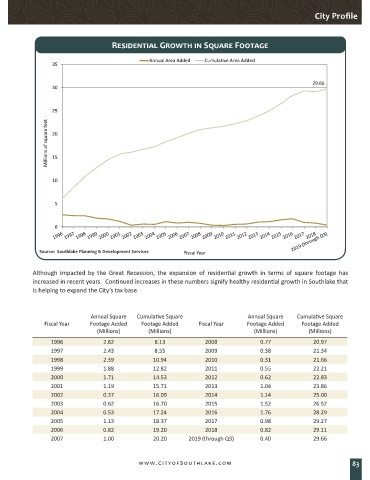
                                      Residential Growth in Square Footage


                                                  Annual Area Added  Cumulative Area Added
                  35

                                                                                                        29.66
                  30


                  25

                 Millions of square feet  20


                  15


                  10


                   5


                   0


              Source:  Southlake Planning & Development Services  Fiscal Year


            Although  impacted  by  the  Great  Recession,  the  expansion  of  residential  growth  in  terms  of  square  footage  has
            increased in recent years.  Continued increases in these numbers signify healthy residential growth in Southlake that
            is helping to expand the City’s tax base.


                               Annual Square   Cumulative Square                   Annual Square   Cumulative Square
                Fiscal Year    Footage Added    Footage Added      Fiscal Year     Footage Added     Footage Added
                                 (Millions)       (Millions)                         (Millions)        (Millions)
                  1996             2.62             6.13             2008              0.77              20.97
                  1997             2.43             8.55             2009              0.38              21.34
                  1998             2.39             10.94            2010              0.31              21.66
                  1999             1.88             12.82            2011              0.55              22.21
                  2000             1.71             14.53            2012              0.62              22.83
                  2001             1.19             15.71            2013              1.04              23.86
                  2002             0.37             16.09            2014              1.14              25.00
                  2003             0.62             16.70            2015              1.52              26.52
                  2004             0.53             17.24            2016              1.76              28.29
                  2005             1.13             18.37            2017              0.98              29.27
                  2006             0.82             19.20            2018              0.82              29.11
                  2007             1.00             20.20      2019 (through Q3)       0.40              29.66


                                               www.CityofSouthlake.com                                                83
   79   80   81   82   83   84   85   86   87   88   89