
Page 85 - Southlake FY20 Budget
P. 85
City Profile
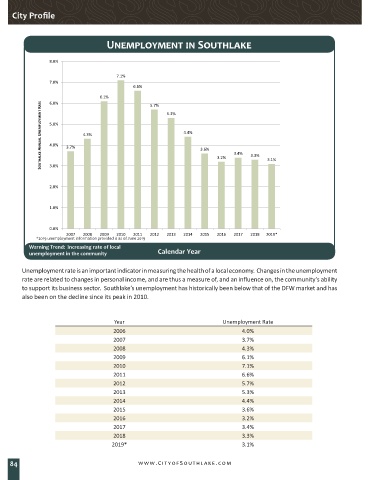
Unemployment in Southlake
8.0%
7.1%
7.0%
6.6%
6.1% 5.7% 5.3%
6.0%
SOUTHALKE ANNUAL UNEMPLOYMENT RATE 5.0% 3.7% 4.3% 4.4% 3.6% 3.2% 3.4% 3.3% 3.1%
4.0%
3.0%
2.0%
1.0%
0.0%
2007 2008 2009 2010 2011 2012 2013 2014 2015 2016 2017 2018 2019*
*2019 unemployment information provided is as of June 2019
Warning Trend: Increasing rate of local
unemployment in the community Calendar Year
Unemployment rate is an important indicator in measuring the health of a local economy. Changes in the unemployment
rate are related to changes in personal income, and are thus a measure of, and an influence on, the community’s ability
to support its business sector. Southlake’s unemployment has historically been below that of the DFW market and has
also been on the decline since its peak in 2010.
Year Unemployment Rate
2006 4.0%
2007 3.7%
2008 4.3%
2009 6.1%
2010 7.1%
2011 6.6%
2012 5.7%
2013 5.3%
2014 4.4%
2015 3.6%
2016 3.2%
2017 3.4%
2018 3.3%
2019* 3.1%
84 www.CityofSouthlake.com