Page 88 - Southlake FY20 Budget
P. 88

City Profile


                                             Office Occupancy Rate


                                    OFFICE OCCUPANCY RATE - SOUTHLAKE  OFFICE OCCUPANCY RATE - DFW MARKET
                 88.0%
                                                                 85.8%  86.0%  85.6%
                 86.0%                                    85.3%                       85.4%  85.3%
                                                   84.6%
                                            84.0%
                 84.0%  83.5%        83.3%
                              82.5%                                     82.3%                82.5%
                                                   81.9%  82.1%
                 82.0%
                                                                 80.5%                80.3%
                 80.0%                   79.8%

                 78.0%
                                                                               77.7%
                        75.6%        75.7%
                 76.0%
                              74.7%
                 74.0%

                 72.0%

                 70.0%

                 68.0%
                        2009   2010   2011   2012   2013   2014   2015   2016  2017   2018   2019
                                                                                            (THROUGH
                                                                                              Q2)
              Warning Trend:
              Decreasing occupancy rates                Calendar Year

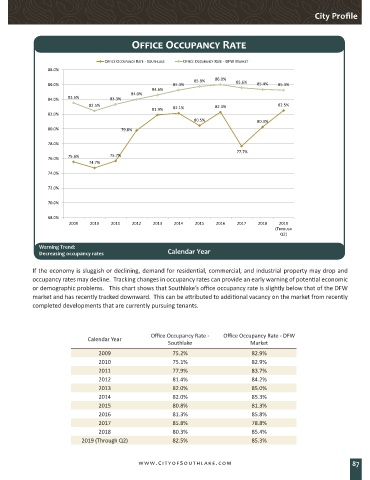
            If the economy is sluggish or declining, demand for residential, commercial, and industrial property may drop and
            occupancy rates may decline.  Tracking changes in occupancy rates can provide an early warning of potential economic
            or demographic problems.   This chart shows that Southlake’s office occupancy rate is slightly below that of the DFW
            market and has recently tracked downward.  This can be attributed to additional vacancy on the market from recently
            completed developments that are currently pursuing tenants.


                                                   Office Occupancy Rate -   Office Occupancy Rate - DFW
                              Calendar Year
                                                         Southlake                  Market
                                  2009                    75.2%                     82.9%
                                  2010                    75.1%                     82.9%
                                  2011                    77.9%                     83.7%
                                  2012                    81.4%                     84.2%
                                  2013                    82.0%                     85.0%
                                  2014                    82.0%                     85.3%
                                  2015                    80.8%                     81.3%
                                  2016                    81.3%                     85.8%
                                  2017                    85.8%                     78.8%
                                  2018                    80.3%                     85.4%
                            2019 (Through Q2)             82.5%                     85.3%


                                               www.CityofSouthlake.com                                                87
   83   84   85   86   87   88   89   90   91   92   93