Page 93 - Southlake FY20 Budget
P. 93

City Profile


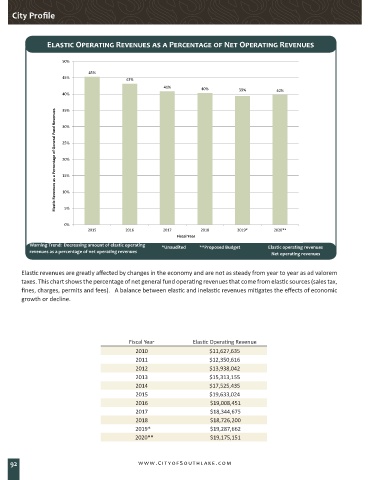
                 Elastic Operating Revenues as a Percentage of Net Operating Revenues


                      50%
                              45%
                      45%                  43%
                                                       41%          40%         39%
                      40%                                                                   40%

                      35%
                   Elastic Revenues as a Percentage of General Fund Revenues  25%

                      30%


                      20%


                      15%

                      10%

                      5%


                      0%
                              2015         2016        2017        2018         2019*       2020**
                                                            Fiscal Year
           Warning Trend:  Decreasing amount of elastic operating   *Unaudited             **Proposed Budget  Elastic operating revenues
           revenues as a percentage of net operating revenues                                Net operating revenues


        Elastic revenues are greatly affected by changes in the economy and are not as steady from year to year as ad valorem
        taxes. This chart shows the percentage of net general fund operating revenues that come from elastic sources (sales tax,
        fines, charges, permits and fees).   A balance between elastic and inelastic revenues mitigates the effects of economic
        growth or decline.


                                            Fiscal Year          Elastic Operating Revenue
                                              2010                    $11,627,635
                                              2011                    $12,350,616
                                              2012                    $13,938,042
                                              2013                    $15,313,155
                                              2014                    $17,525,435
                                              2015                    $19,633,024
                                              2016                     $19,008,451
                                              2017                     $18,344,675
                                              2018                     $18,726,200
                                               2019*                   $19,287,662
                                                2020**                 $19,175,151


    92                                         www.CityofSouthlake.com
   88   89   90   91   92   93   94   95   96   97   98