
Page 97 - Southlake FY20 Budget
P. 97
City Profile
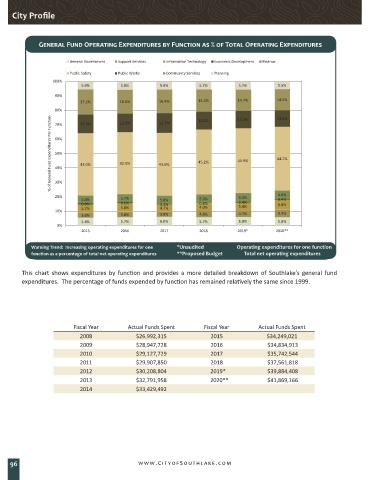
General Fund Operating Expenditures by Function as % of Total Operating Expenditures
General Government Support Services Information Technology Economic Development Finance
Public Safety Public Works Community Services Planning
100%
5.6% 5.8% 5.6% 5.7% 5.7% 5.5%
90%
17.2% 16.6% 16.4% 15.3% 14.7% 14.5%
80% 13.3% 13.0% 13.7% 12.4% 12.2% 11.6%
% of General Fund Expenditures Per Function 60% 43.0% 42.9% 43.6% 45.2% 44.9% 44.1%
70%
50%
40%
30%
20% 6.1% 6.0%
5.6% 5.7% 5.8% 5.9% 0.4%
0.6% 0.6% 0.3% 0.4% 0.4% 6.8%
5.7% 5.8% 4.7% 4.9% 5.4%
10%
3.6% 3.8% 3.8% 4.6% 4.7% 5.4%
5.4% 5.7% 6.0% 5.7% 5.9% 5.8%
0%
2015 2016 2017 2018 2019* 2020**
Warning Trend: Increasing operating expenditures for one *Unaudited Operating expenditures for one function
*Unaudited **Proposed Budget*Unaudited **Proposed Budget
function as a percentage of total net operating expenditures **Proposed Budget Total net operating expenditures
This chart shows expenditures by function and provides a more detailed breakdown of Southlake’s general fund
expenditures. The percentage of funds expended by function has remained relatively the same since 1999.
Fiscal Year Actual Funds Spent Fiscal Year Actual Funds Spent
2008 $26,992,315 2015 $34,249,021
2009 $28,947,728 2016 $34,834,913
2010 $29,127,729 2017 $35,742,544
2011 $29,907,850 2018 $37,561,818
2012 $30,208,804 2019* $39,884,408
2013 $32,791,958 2020** $41,869,166
2014 $33,429,492
96 www.CityofSouthlake.com