Page 98 - Southlake FY20 Budget
P. 98

City Profile


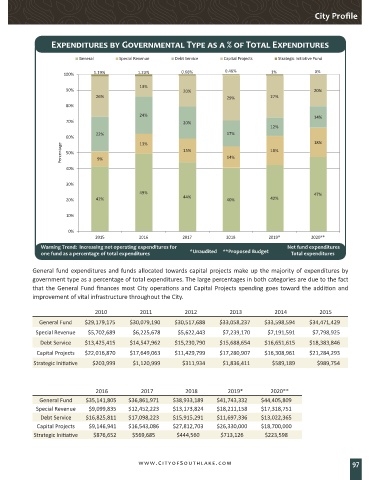
                  Expenditures by Governmental Type as a % of Total Expenditures


                           General      Special Revenue    Debt Service    Capital Projects  Strategic Initiative Fund

                      100%      1.19%          1.23%         0.68%         0.46%           1%            0%
                                               13%
                       90%                                    20%                                        20%
                                 26%                                        29%           27%
                       80%
                                               24%                                                       14%
                       70%                                    20%
                                                                                          12%
                                 22%                                        17%
                       60%                     13%                                                       18%
                     Percentage  50%  9%                      15%           14%           18%


                       40%

                       30%
                                               49%                                                       47%
                       20%       42%                          44%           40%           42%

                       10%

                        0%
                                 2015          2016          2017           2018          2019*         2020**
               Warning Trend:  Increasing net operating expenditures for                        Net fund expenditures
                                                                                     *Unaudited      **Proposed Budgetotal expenditures
               one fund as a percentage of total expenditures   *Unaudited     **Proposed Budget     T
            General fund expenditures and funds allocated towards capital projects make up the majority of expenditures by
            government type as a percentage of total expenditures. The large percentages in both categories are due to the fact
            that the General Fund finances most City operations and Capital Projects spending goes toward the addition and
            improvement of vital infrastructure throughout the City.


                                2010           2011           2012           2013           2014           2015
              General Fund    $29,179,175    $30,079,190    $30,517,688    $33,058,237    $33,598,594   $34,471,429
             Special Revenue   $5,702,689     $6,225,678    $5,622,443     $7,239,170     $7,191,591     $7,798,925
              Debt Service    $13,425,415    $14,547,962    $15,230,790    $15,688,654    $16,651,615    $18,383,846
             Capital Projects   $22,016,870    $17,649,063    $11,429,799    $17,280,907    $16,308,961    $21,284,293
            Strategic Initiative   $203,999    $1,120,999     $311,934     $1,836,411       $589,189      $989,754


                                 2016           2017          2018          2019*          2020**
              General Fund    $35,141,805    $36,861,971    $38,933,189    $41,743,332    $44,405,809
             Special Revenue   $9,099,835    $12,452,223    $13,173,824    $18,211,158    $17,318,751
              Debt Service    $16,825,811    $17,098,223    $15,915,291    $11,697,336    $13,022,365
             Capital Projects   $9,146,941    $16,543,086    $27,812,703    $26,330,000    $18,700,000
            Strategic Initiative   $876,652    $569,685     $444,560       $713,126      $223,598


                                               www.CityofSouthlake.com                                                97
   93   94   95   96   97   98   99   100   101   102   103