Page 81 - Southlake FY20 Budget
P. 81

City Profile


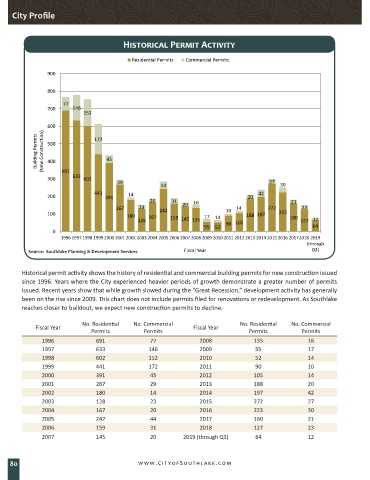
                                          Historical Permit Activity


                                             Residential Permits  Commercial Permits
                 900


                 800

                      77
                 700     146
                             152
                 600
             Building Permits   (New Construction)  500  172  45


                 400


                 300  691  633  602
                                        29                                                27
                                                      44                                      30
                                441        14                                          42
                 200                391                                            20
                                                   20     31     16                              21
                                       267     23     242    20             10  14        272        23
                 100                       180    167                17            188 197   223
                                               128       159  145 135   14     105               160  127 12
                                                                     55  52  90                         64
                  0
                     1996 1997 1998 1999 2000 2001 2002 2003 2004 2005 2006 2007 2008 2009 2010 2011 2012 2013 2014 2015 2016 20172018 2019
                                                                                                       (through
          Source:  Southlake Planning & Development Services  Fiscal Year                               Q3)


        Historical permit activity shows the history of residential and commercial building permits for new construction issued
        since 1996. Years where the City experienced heavier periods of growth demonstrate a greater number of permits
        issued. Recent years show that while growth slowed during the “Great Recession,” development activity has generally
        been on the rise since 2009. This chart does not include permits filed for renovations or redevelopment. As Southlake
        reaches closer to buildout, we expect new construction permits to decline.

                            No. Residential   No. Commercial                    No. Residential   No. Commercial
             Fiscal Year                                         Fiscal Year
                               Permits           Permits                           Permits           Permits
               1996              691               77              2008              135               16
               1997              633              146              2009              55                17
               1998              602              152              2010              52                14
               1999              441              172              2011              90                10
               2000              391               45              2012              105               14
               2001              267               29              2013              188               20
               2002              180               14              2014              197               42
               2003              128               23              2015              272               27
               2004              167               20              2016              223               30
               2005              242               44              2017              160               21
               2006              159               31              2018              127               23
               2007              145               20         2019 (through Q3)      64                12


    80                                         www.CityofSouthlake.com
   76   77   78   79   80   81   82   83   84   85   86