Page 104 - Southlake FY20 Budget
P. 104

City Profile


                  Property Tax Supported Long-Term Debt as a % of Assessed Valuation


                                                                                                  Desired Range
                                                   Long-Term Debt  Debt as % of Assessed Valuation
                          3.50%                                                                 $120,000,000

                              3.29%
                          3.00%
                                 3.01%                                                          $100,000,000
                                     2.79%
                          2.50%                                                                 $80,000,000
                        Percentage of Valuation  2.00%  2.36%  2.07%  2.00%


                                                  1.71%                                         $60,000,000  Dollars
                          1.50%
                                                      1.46%  1.49% 1.51% 1.49%
                                                                   1.37%
                                                                                                $40,000,000
                                                                       1.19%
                          1.00%                                           1.12%
                                                                             0.92%
                                                                                 0.72%          $20,000,000
                          0.50%                                                     0.58%
                                                                                        0.44%
                                                                                           0.34%
                          0.00%                                                                 $-
                              2002 2003 2004 2005 2006 2007 2008 2009 2010 2011 2012 2013 2014 2015 2016 2017 2018 2019 2020
                                                          Fiscal Year
               Warning Trend:  Increasing net long-term debt as a                                   Long-term debt
               percentage of assessed valuation                                                    Assessed valuation

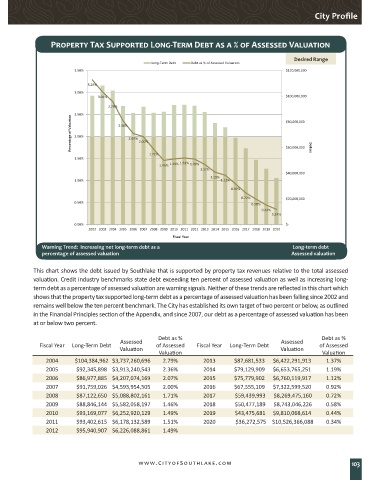
            This chart shows the debt issued by Southlake that is supported by property tax revenues relative to the total assessed
            valuation. Credit industry benchmarks state debt exceeding ten percent of assessed valuation as well as increasing long-
            term debt as a percentage of assessed valuation are warning signals. Neither of these trends are reflected in this chart which
            shows that the property tax supported long-term debt as a percentage of assessed valuation has been falling since 2002 and
            remains well below the ten percent benchmark. The City has established its own target of two percent or below, as outlined
            in the Financial Principles section of the Appendix, and since 2007, our debt as a percentage of assessed valuation has been
            at or below two percent.

                                                     Debt as %                                             Debt as %
                                         Assessed                                             Assessed
              Fiscal Year  Long-Term Debt            of Assessed   Fiscal Year  Long-Term Debt             of Assessed
                                         Valuation                                            Valuation
                                                      Valuation                                             Valuation
                2004      $104,384,962 $3,737,260,696  2.79%        2013       $87,681,533  $6,422,291,913   1.37%
                2005      $92,345,898 $3,913,240,543   2.36%        2014       $79,129,909  $6,653,765,251   1.19%
                2006      $86,977,885 $4,207,074,169   2.07%        2015       $75,779,902  $6,760,119,917   1.12%
                2007      $91,759,026 $4,593,954,505   2.00%        2016       $67,555,109  $7,322,599,520   0.92%
                2008      $87,122,650 $5,088,802,161   1.71%        2017       $59,439,993   $8,269,475,160   0.72%
                2009      $88,846,144 $5,582,058,197   1.46%        2018       $50,477,189   $8,743,046,226   0.58%
                2010      $93,169,077 $6,252,920,129   1.49%        2019       $43,475,681   $9,810,068,614   0.44%
                2011      $93,402,615 $6,178,132,589   1.51%        2020        $36,272,575   $10,526,366,088   0.34%
                2012      $95,940,907 $6,226,088,861   1.49%


                                               www.CityofSouthlake.com                                               103
   99   100   101   102   103   104   105   106   107   108   109