Page 193 - Southlake FY20 Budget
P. 193

City Department Overview

      HUMAn RESOURCES


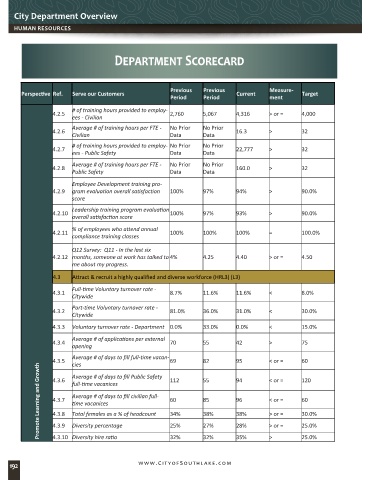
                                       Department Scorecard


                                                         Previous   Previous              Measure-
        Perspective Ref.  Serve our Customers                                  Current               Target
                                                         Period     Period                ment
                         # of training hours provided to employ-
                  4.2.5                                  2,760      5,067      4,316      > or =     4,000
                         ees - Civilian
                         Average # of training hours per FTE -   No Prior   No Prior
                  4.2.6                                                        16.3       >          32
                         Civilian                        Data       Data
                         # of training hours provided to employ- No Prior   No Prior
                  4.2.7                                                        22,777     >          32
                         ees - Public Safety             Data       Data
                         Average # of training hours per FTE -   No Prior   No Prior
                  4.2.8                                                        160.0      >          32
                         Public Safety                   Data       Data
                         Employee Development training pro-
                  4.2.9  gram evaluation overall satisfaction   100%  97%      94%        >          90.0%
                         score
                         Leadership training program evaluation
                  4.2.10                                 100%       97%        93%        >          90.0%
                         overall satisfaction score
                         % of employees who attend annual
                  4.2.11                                 100%       100%       100%       =          100.0%
                         compliance training classes

                         Q12 Survey:  Q11 - In the last six
                  4.2.12 months, someone at work has talked to 4%   4.25       4.40       > or =     4.50
                         me about my progress.
                   4.3   Attract & recruit a highly qualified and diverse workforce (HRL3) (L3)

                         Full-time Voluntary turnover rate -
                  4.3.1                                  8.7%       11.6%      11.6%      <          8.0%
                         Citywide
                         Part-time Voluntary turnover rate -
                  4.3.2                                  81.0%      36.0%      31.0%      <          30.0%
                         Citywide

                  4.3.3  Voluntary turnover rate - Department 0.0%  33.0%      0.0%       <          15.0%
                         Average # of applications per external
                  4.3.4                                  70         55         42         >          75
                         opening
                         Average # of days to fill full-time vacan-
                  4.3.5  cies                            69         82         95         < or =     60
              Promote Learning and Growth  4.3.7  full-time vacanices  60  85  96         < or =     60
                         Average # of days to fill Public Safety
                                                                    55
                                                                                                     120
                                                                               94
                                                                                          < or =
                  4.3.6
                                                         112
                         Average # of days to fill civilian full-
                         time vacanices
                                                                    38%
                         Total females as a % of headcount
                                                                               38%
                  4.3.8
                                                                                          > or =
                                                         34%
                                                                                                     30.0%
                         Diversity percentage
                                                                                          > or =
                                                                               28%
                                                                                                     25.0%
                                                         25%
                  4.3.9
                                                                    27%
                                                         32%
                                                                    32%
    192           4.3.10 Diversity hire ratio  www.CityofSouthlake.com         35%        >          25.0%
   188   189   190   191   192   193   194   195   196   197   198