
Page 447 - Microsoft Word - FY 2020 Adopted Budget Document
P. 447
61% 28% 78% 93% 7,679 100% $903,240 70% $1,110 1.47% 78% 10% $87,330 100% 0% 0% 20% 100% 98% 20 $5,332 1.0% 75% 89% 135 19% 0 25 833 3,160 $546,815 67,494 0% 88 25% 191 4.85 40%
Sept. $1,293,876 % 9 . 0 % 2 . 0 8 4 6 6 3 1 7 1 2 1
68% 48% 76% 90% 7,838 99% $935,492 70% $1,110 1.47% 78% $9,700 Yes 100% 0% 0% 20% 100% 100% 43 $3,582 0.6% 75% 111 7% 0.001 19 1,136 2,798 $875,769 74,091 58% 55 25% 185 4.77 47%
Aug. $1,331,029 % 3 . 0 % 2 . 0 9 2 0 4 2 1 0 0 6
78% 92% 75% 91% 9,301 99% $950,016 70% $1,110 1.47% 78% $158,320 100% 0% 0% 20% 100% 99% 29 $2,518 1.0% 74% 110 2% 0.001 20 1,288 17,599 86,897 53% 46 25% 185 4.78 52%
July $1,359,240 % 3 . 0 % 5 . 0 7 $6,409,687 2 0 5 7 0 0 0 8
55.9% 40% 75% 93% 7,911 100% 81% 16.9% $1,111 1.65% 75% 10% $63,598 Yes 100% 0% 0% 5 Stars 15% 100% 92% 35 $1,928 1.7% 74% 10 8% 0.000 46 2,753 6,860 $704,795 59,106 88% 64 25% 184 4.77 52%
June $1,337,779 $1,078,749 % 3 . 0 % 2 . 0 7 2 1 1 1 5 0 6 0 4
71% 50% 75% 91% 7,290 98% 74% 16.9% $1,111 1.65% 75% $3,018 100% 0% 0% 15% 100% 100% 22 $2,321 0.8% 74% 93 6% 0.000 49 2,754 14,806 4,859 39% 50 26% 183 0 46%
May $1,463,388 $1,078,749 % 6 . 0 % 6 . 0 1 1 $2,576,953 4 1 1 2 5 1 11 0 9
303% 81% 75% 94% 6,235 100% 72% 16.9% $1,111 1.65% 75% $23,458 Affirm 100% 0% 0% 15% 100% 98% 31 $3,277 0.8% 71% 117 4% 0.000 40 922 3,613 41,859 49% 53 26% 183 7 4.26 57%
April $1,632,180 $1,172,510 % 0 . 0 % 6 . 0 1 1 $4,071,176 3 0 2 0 1 6
73.93% 74% 75% 96% 6,689 98% 66% 16.4% $1,064 1.74% 75% 8% $244,342 Yes 100% 0% 0% 15% 100% 97% 27 $6,304 0.8% 73% 69 7% 0.000 52 4,467 14,078 50,515 15% 75 27% 182 11 4.61 38%
Mar. $1,983,366 $1,306,244 % 0 . 0 % 3 . 0 3 1 $3,882,407 6 0 0 0 2 7
67.42% 77% 74% 93% 4,836 98% $1,694,686 $1,063,285 63% 16.4% $1,064 1.74% 75% $44,950 100% 0% 0% 15% 100% 92% 21 $10,958 0.6% 74% 91 5% 0.0010 12 2,904 14,882 $3,788,235 33,681 49% 67 27% 182 5 5 59%
Feb. 0.0% % 3 . 0 9 5 0 0 1 1 5
72.14% 32% 74% 94% 5,964 100% $929,171 71% 16.4% $1,064 1.74% 75% $0 100% 0% 0% 15% 100% 88% 21 $13,127 0.5% 0.3% 74% 102 5% 0.003 31 0 10,719 $525,992 39,022 20% 89 27% 181 0 4.83 40%
Jan. $1,307,157 % 5 . 0 5 0 1 8 1 3 1 2 6
56.94% 4% 72% 64% 4,951 100% $684,246 64% 16.4% $1,064 1.74% 85% 7% $218,710 100% 0% 0% 10% 100% 100% 22 $3,191 0.9% 0.0% 74% 1,205 13% 0.001 8 0 10,743 $517,443 87,788 0% 39 27% 178 20 0 29%
Dec. $1,076,609 % 0 . 0 5 0 0 1 1 1 5
22 19 51 0 0
0%
0%
65.11% 37% 72% 67% 5,468 100% $740,661 62% 16.4% $1,064 1.74% 85% $23,920 100% 10% 100% 100% $6,806 0.5% 0.0% 74% 123 11% 0.001 4,406 667 57,103 46% 28% 179 59%
Nov. $1,200,629 % 0 . 0 3 $3,552,269 4 7 9 1 3 3 2 5
567.59% 122% 72% 67% 5,591 100% $1,321,616 $970,645 73% 16.4% $1,064 1.74% $2,682,648 85% $22,020 100% 0% 0% 10% 100% 100% 0.177% 37 $8,009 0.6% 0.0% 74% 78 10% 0.001 21 510 192 $1,012,784 45,041 57% 67 30% 178 0 4.79 48%
Oct. % 3 . 0 5 1 2 7 1 4 3 1 3
FY 2019 Actual 110% 51% 75% 86% 79,753 100% $17,001,555 $11,813,008 69% $1,110 1.47% $2,682,648 78% 10% $899,366 Yes Yes Yes Yes Affirm 100% 0% 0% 5 Stars 20% 100% 97% 0.177% 330 $5,291 9.9% 3.0% % 4 . 3 74% 89% 3,865 97% 0.010 342 21,973 100,117 8 0 1 $28,464,325 691,256 4 3 42% 744 26% 184 8 2 0 , 1 5 3 2 1 67 4.7 50% 3 1 6 7
69% 53% 76% 91% 24,818 99% 70% $1,110 1.47% 78% 10% $255,350 Yes 100% 0% 0% 20% 100% 98% 92 $3,627 2.6% 1.5% 75% 89% 356 28% 0.003 64 3,257 23,557 228,482 37% 189 25% 191 7 4.8 46%
FY 2019 4th Qtr. Actual $3,984,145 $2,788,748 % 9 . 0 4 2 $7,832,271 8 6 5 1 2 1 2 1 6 2
FY 2019 3rd Qtr. Actual 143.3% 54% 75% 93% 21,436 99% $4,433,347 $3,330,008 76% 16.9% $1,111 1.65% 75% 10% $90,074 Yes Affirm 100% 0% 0% 5 Stars 15% 100% 97% 88 $2,502 3.3% 0.9% % 4 . 1 73% 220 18% 0 135 6,429 25,279 9 2 $7,352,924 149,624 9 59% 167 26% 184 2 2 3 2 1 1 21 4.51 52% 3 9 1
FY 2019 2nd Qtr. Actual 71.16% 57% 75% 96% 17,489 99% $4,985,209 $3,298,700 67% 16.4% $1,064 1.74% 75% 8% $289,292 Yes 100% 0% 0% 15% 100% 92% 69 $9,797 2% 0.3% % 1 . 1 74% 261 17% 0.004 95 7,371 39,679 2 4 $8,196,634 123,218 2 1 28% 231 27% 182 1 8 1 3 2 16 4.81 46% 5 8 1
FY 2019 1st Qtr. Actual 229.7% 39% 72% 64% 16,010 100% $3,598,854 $2,395,552 66% 16.4% $1,064 1.74% $2,682,648 85% 7% $264,650 100% 0% 0% 10% 100% 100% 0.177% 81 $6,374 2% 0.3% % 0 74% 1,406 34% 0.003 48 4,916 11,602 3 1 $5,082,496 189,932 5 34% 157 28% 178 9 6 3 8 7 20 4.79 47% 4 3 1
FY 2019 Annual Target 100% 75% 80% 100% 75,000 100% $15,566,154 $10,118,000 65% <20% $1,180 <2% 0.6% $2,700,000 70% 6.5% $1,000,000 Yes Yes Yes Yes Affirm 100% <1% 0% 5 Stars 20% 100% 95% 0.2% 354 $3,300 60% 8% 1.9% % 3 75% 90% 2,104 100% <2 340 28,000 55,000 5 1 1 $7,500,000 650,000 2 4 48% 450 30% 193 0 0 3 , 3 0 8 0 8 65 4.8 55% 0 2 0 8
FY 2018 Actual 106.7% 81% 78% 81% 73,547 100% $16,401,847 $10,775,588 66% 16% $1,064 1.74% 0.47% $2,683,011 82% 21% $1,286,300 Yes Yes Yes Yes Affirm & Upgrade 100% 0% 0% 5 Stars 19% 100% 99% 0.21% 359 $3,766 52% 8.9% 2% % 3 75% 88% 2,336 94% 0.01 345 14,782 82,005 1 9 $23,329,424 749,703 9 2 51% 457 30% 178 6 1 6 , 2 7 5 8 7 69 4.73 51% 2 2 2 7
FY 2017 Actual 88% 86% 76% 87% 87,209 97% $17,201,760 $11,379,523 66% 17% $997 1.79% 0.33% $2,756,196 10.79% Yes Yes Yes Yes Affirm & Upgrade 100% 0% 0% 5 Stars 100% 97% 0.2563% 367 $3,503 59% 6.3% 2.2% % 1 . 4 75% 89.5% 100% 0.02 290 31,963 63,547 6 9 $6,024,880 658,754 7 4 56% 387 28% 171 0 3 0 , 3 0 8 1 8 53 4.71 53% 1 3 5 7
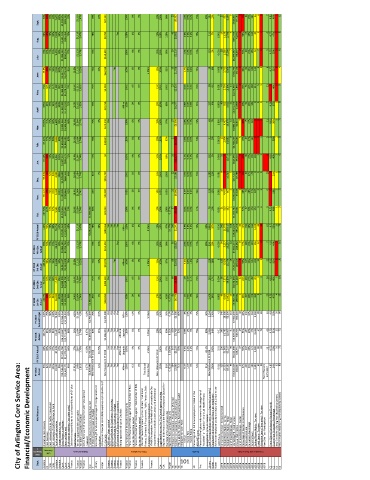
City of Arlington Core Service Area:
90% 82% 79% 107% 90,020 80% $18,746,413 $12,420,771 66% 17.41% $956 1.81% 0.27% $2,833,896 New Measure in FY 2018 12% New Measure in FY 2018 Yes Yes Yes Yes Affirm 100% <1% 0% Traditional Finance Star New Measure in FY 2018 100% 98% 0.322% 364 $2,800 71% 9.2% 1.5% % 3 73% 91% New Measure in FY 2018 100% 0.011 325 25,324 68,132 5 9 $10,444,615 584,837 4 4 47% 410 29% 193 4 9 3 , 2 0 6 9 5 New Measure
Financial/Economic Development s Key Measures Dept. Goal Categorie Operating cost recovery Aviation Cost Recovery CC Cost Cost recovery of Parks Performance Fund Parks Recovery Cost recovery of Golf Performance Fund Parks Total aircraft operations Aviation Hangar occupancy rate Aviation Gross Revenue collected Court Revenue Retained Court % of revenue retained (less state costs) Court Debt service expenditures to total expenditures of GF plus Fi
FY 2016
Actual
Employee Turnover Rate:
Civilian
HR