
Page 365 - Microsoft Word - FY 2020 Adopted Budget Document
P. 365
107% 7,664 391 81% 59% 24% 1,324 1,484 28,690 10,262 2,107 217 25 49 77,312
Sept. 8 1
9,908 535 76% 46% 31% 1,378 1,474 23,346 2,941 235 24 49 75,416
Aug. 2 1 1
9,258 518 73% 53% 24% 1,175 1,764 15,945 2,231 235 24 49 74,044 5
July 9 1 3
106% 8,679 379 74% 51% 24% 1,178 1,526 14,967 14 $150,000 17,356 2,245 234 25 49 72,762
June 8 3
6,059 441 74% 45% 30% 1,132 1,382 26,842 2,840 234 24 58 70,992 24 11
May 8 6
100% 100% 7,069 371 84% 32% 32% 2,185 1,518 26,471 2,715 233 69,797
6 24 58
April 5 1 2
69% 71% 59% 55% 57% 73% 102% 7,290 475 87% 52% 39% 1,498 1,312 10,144 10,601 2,436 233 24 55 68,280 8
Mar. 9 1
6,079 359 86% 48% 46% 966 1,121 34,494 2,412 233 26 57 66,191
Feb. 8 1
6,768 386 90% 51% 48% 1,026 1,434 18,508 2,753 232 24 54 64,925
Jan. 4 1
103% High 4,457 389 82% 53% 48% 945 931 8,537 5,524 1,786 232 27 56 63,517 31
Dec. Performer 3 1
5,622 439 77% 47% 45% 964 1,114 30,424 2,199 232 27 54 62,232 42
Nov. 4 1 4
86,521 488 74% 34% 40% 943 1,410 53,947 2,326 234 27 223 54 61,183
Oct. 6 1
69% 71% 59% 55% 57% 73% 105% 63 High 6 100% 100% 87,474 5,171 80% 48% 36% 14,723 18,390 292,315 $150,000 43,743 28,991 217 25 223 49 77,312 24 11
FY 2019 Actual Performer 4 0 1 2 14 5
FY 2019 4th Qtr. Actual 108% 12 26,830 9 3 1,444 77% 2 53% 26% 3,886 4,722 67,981 10,262 7,279 217 25 49 77,312 5
106% 14 6 100% 100% 21,807 1,191 77% 43% 29% 4,495 4,426 68,280 $150,000 17,356 7,800 234 25 49 72,762 24 11
FY 2019 3rd Qtr. Actual 1 3 4 14 8
69% 71% 59% 55% 57% 73% 102% 15 20,137 1,220 88% 50% 44% 3,490 3,867 63,146 10,601 7,601 233 24 55 68,280
FY 2019 2nd Qtr. Actual 1 2 1
FY 2019 1st Qtr. Actual 103% 24 High Performer 18,700 3 1 1,316 78% 1 45% 44% 2,852 3,455 92,908 5,524 6,311 232 27 223 56 63,517 31 42 4
FY 2019 Annual Target 80% 80% 70% 70% 70% 85% 99% 71 High Performer 14 100% 100% 77,000 0 5 2 6,950 78% 3 50% 32% 14,280 20,000 200,000 10 $95,000 41,000 36,000 230 60 200 67 45,000 45 45 5 1
69% 71% 64% 59% 61% 79% 104% 67 7 100% 100% 81,867 6,020 79% 47% 25% 15,376 19,654 41,568 33,577 234 28 223 54 60,096 50 40
FY 2018 Actual 4 4 1 1 8
73% 77% 67% 58% 61% 78% 100% 87 11 100% 100% 87,290 6,553 77% 82% 37% 13,892 24,002 38,495 29,443 227 43 196 55 32,851 78 27
FY 2017 Actual New Measure in FY 2019 7 5 2 2 New Measure in FY 2019 New Measure in FY 2019 New Measure in FY 2019
76% 78% 64% 57% 62% 81% 98% 72 17 100% 100% 79,755 0 6 1 7,688 75% 2.07 New Measure in FY 2017 New Measure in FY 2017 12,486 31,914 41,035 36,025 220 56 191 64 31,428
FY 2016
Actual
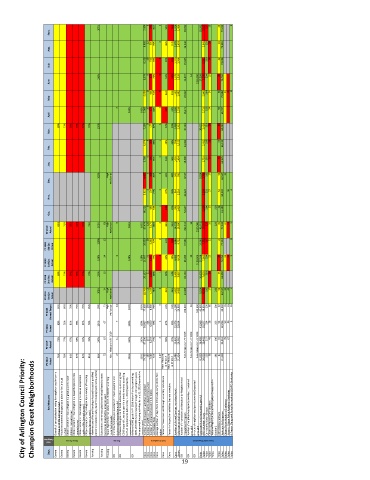
City of Arlington Council Priority: Champion Great Neighborhoods Key Measures Overall citizen satisfaction rating for neighborhood in terms of quality of life [annual survey] Would recommend Arlington as a place to live [annual survey] Citizen perception that Arlington is a great place to raise children [annual survey] Citizen perception that Arlington is a beautiful place to live [annual survey] Citizen perception that Arlington provides an exceptional quality of l
Categories
Housing
Code Compliance
Citizen Survey
Goal
General
General
General
Dept.
General
General
General
Housing
Housing
Housing
Library
Code
Code
Code
Code
Code
Code
Code
Code
OSI
OSI
OSI
OSI
19 OSI OSI Parks Police Police Police Community Engagement Police Police Police Police Police Police