
Page 222 - Manfield FY21 Budget
P. 222
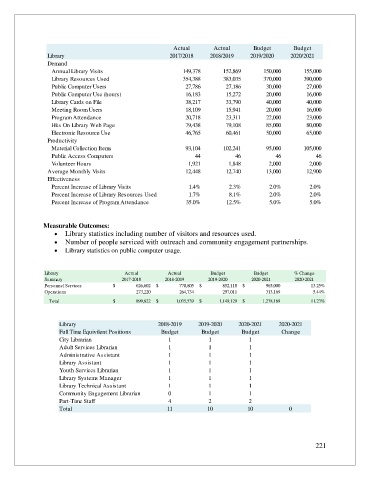
Actual        Actual       Budget       Budget
                 Library                                 2017/2018     2018/2019    2019/2020    2020/2021
                 Demand
                  Annual Library Visits                       149,378      152,869      150,000       155,000
                  Library Resources Used                      354,388      383,035      370,000       390,000
                  Public Computer Users                       27,786        27,186       30,000       27,000
                  Public Computer Use (hours)                 16,183        15,272       20,000       16,000
                  Library Cards on File                       38,217        33,790       40,000       40,000
                  Meeting Room Users                          18,109        15,941       20,000       16,000
                  Program Attendance                          20,718        23,311       22,000       23,000
                  Hits On Library Web Page                    79,438        79,108       85,000       80,000
                  Electronic Resource Use                     46,765        60,461       50,000       65,000
                 Productivity
                  Material Collection Items                   93,104       102,241       95,000      105,000
                  Public Access Computers                         44           46           46            46
                  Volunteer Hours                              1,921         1,848        2,000        2,000
                 Average Monthly Visits                       12,448        12,740       13,000       12,900
                 Effectiveness
                  Percent Increase of Library Visits           1.4%          2.3%         2.0%         2.0%
                  Percent Increase of Library Resources Used   1.7%          8.1%         2.0%         2.0%
                  Percent Increase of Program Attendance       35.0%        12.5%         5.0%         5.0%


               Measurable Outcomes:
                   •  Library statistics including number of visitors and resources used.
                   •  Number of people serviced with outreach and community engagement partnerships.
                   •  Library statistics on public computer usage.


                Library                   Actual         Actual        Budget        Budget       % Change
                Summary                  2017-2018      2018-2019     2019-2020     2020-2021     2020-2021

                Personnel Services    $                      626,602  $                      770,805  $                      852,118  $                    965,000  13.25%


                Operations                                  273,220                        264,734                        297,011                          313,169  5.44%


                 Total                $                    899,822  $                 1,035,539  $                 1,149,129  $                 1,278,169  11.23%


                     Library                         2018-2019     2019-2020    2020-2021    2020-2021
                     Full Time Equivilent Positions   Budget        Budget       Budget       Change
                     City Librarian                      1            1            1
                     Adult Services Librarian            1            1            1
                     Administrative Assistant            1            1            1
                     Library Assistant                   1            1            1
                     Youth Services Librarian            1            1            1
                     Library Systems Manager             1            1            1
                     Library Technical Assistant         1            1            1
                     Community Engagement Librarian      0            1            1
                     Part-Time Staff                     4            2            2
                     Total                              11            10           10            0


                                                                                                         221