
Page 153 - Manfield FY21 Budget
P. 153
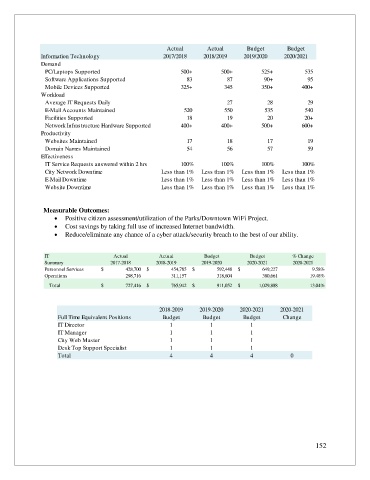
Actual        Actual       Budget       Budget
               Information Technology                  2017/2018    2018/2019     2019/2020    2020/2021
               Demand
                PC/Laptops Supported                         500+         500+          525+                      535


                Software Applications Supported                              83                        87  90+                          95

                Mobile Devices Supported                     325+                      345  350+     400+
               Workload

                Average IT Requests Daily                                                27                          28                        29

                E-Mail Accounts Maintained                               520                        550                        535                      540


                Facilities Supported                                         18                        19                          20  20+
                Network Infrastructure Hardware Supported    400+         400+          500+         600+
               Productivity

                Websites Maintained                                          17                        18                        17                        19


                Domain Names Maintained                                      54                        56                          57                          59
               Effectiveness
                IT Service Requests answered within 2 hrs    100%         100%          100%         100%
                City Network Downtime                 Less than 1%  Less than 1%  Less than 1%  Less than 1%
                E-Mail Downtime                       Less than 1%  Less than 1%  Less than 1%  Less than 1%
                Website Downtime                      Less than 1%  Less than 1%  Less than 1%  Less than 1%


               Measurable Outcomes:
                   •  Positive citizen assessment/utilization of the Parks/Downtown WiFi Project.
                   •  Cost savings by taking full use of increased Internet bandwidth.
                   •  Reduce/eliminate any chance of a cyber attack/security breach to the best of our ability.


                IT                     Actual         Actual         Budget         Budget        % Change
                Summary               2017-2018      2018-2019      2019-2020      2020-2021      2020-2021


                Personnel Services  $                    428,700  $                      454,785  $                    592,448  $                      649,227  9.58%
                Operations                              298,716                        311,157                        318,604                          380,661  19.48%


                 Total            $                      727,416  $                      765,942  $                      911,052  $                   1,029,888  13.04%

                                                      2018-2019    2019-2020    2020-2021     2020-2021
                    Full Time Equivalent Positions     Budget       Budget       Budget        Change
                    IT Director                          1             1            1
                    IT Manager                           1             1            1
                    City Web Master                      1             1            1
                    Desk Top Support Specialist          1             1            1
                    Total                                4             4            4            0


                                                                                                         152