
Page 145 - Manfield FY21 Budget
P. 145
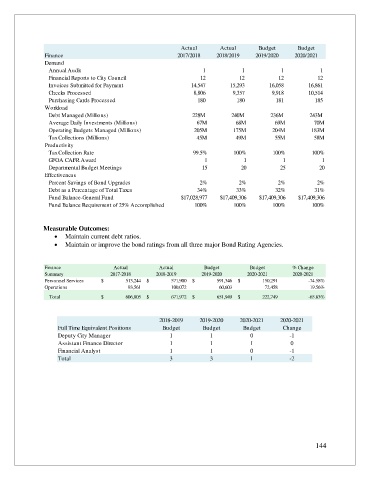
Actual       Actual       Budget       Budget
                Finance                                     2017/2018    2018/2019    2019/2020    2020/2021
                Demand
                 Annual Audit                                                       1                            1                          1                            1


                 Financial Reports to City Council                                12                          12                        12                          12
                 Invoices Submitted for Payment                          14,547                   15,293                   16,058                   16,861


                 Checks Processed                                            8,806                   9,357                   9,918                   10,514
                 Purchasing Cards Processed                                   180                        180                      181                      185


                Workload
                 Debt Managed (Millions)                         228M         240M         236M        243M
                 Average Daily Investments (Millions)             67M          68M          69M          70M
                 Operating Budgets Managed (Millions)            205M         175M         204M         183M
                 Tax Collections (Millions)                       45M          49M          55M          58M
                Productivity
                 Tax Collection Rate                             99.5%        100%         100%         100%
                 GFOA CAFR Award                                     1            1            1            1
                 Departmental Budget Meetings                       15           20           25           20
                Effectiveness
                 Percent Savings of Bond Upgrades                  2%           2%           2%           2%
                 Debt as a Percentage of Total Taxes              34%          33%          32%          31%
                 Fund Balance-General Fund                   $17,028,977  $17,409,306  $17,409,306  $17,409,306
                 Fund Balance Requirement of 25% Accomplished    100%         100%         100%         100%


               Measurable Outcomes:
                   •  Maintain current debt ratios.
                   •  Maintain or improve the bond ratings from all three major Bond Rating Agencies.


                Finance                Actual         Actual         Budget         Budget        % Change
                Summary               2017-2018      2018-2019      2019-2020      2020-2021      2020-2021


                Personnel Services  $                      513,244  $                    571,900  $                    591,346  $                      150,291  -74.58%
                Operations                                  93,561                          100,072                            60,603                            72,458  19.56%

                 Total            $                    606,805  $                      671,972  $                    651,949  $                    222,749  -65.83%


                                                      2018-2019    2019-2020    2020-2021     2020-2021
                    Full Time Equivalent Positions     Budget       Budget       Budget        Change
                    Deputy City Manager                  1             1            0            -1
                    Assistant Finance Director           1             1            1            0
                    Financial Analyst                    1             1            0            -1
                    Total                                3             3            1            -2


                                                                                                         144