
Page 373 - FY 2009 Proposed Budget
P. 373
Enhance Regional Mobility
Goal 2: Plan, Manage, and Maintain Public Transportation Infrastructure
Objective 1: Optimize Effectiveness and Efficiency of Existing Transportation System
Project Performance Measure(s) City Service Team (Department)
ERM Update Street Citizen perception of overall road Economic Development and Capital
2.1.1 Condition condition as “good” or “excellent” Investment (PWT)
Lane Miles with Overall Condition Index
(OCI) <50
Summary:
OCI Progress – Current and Previous
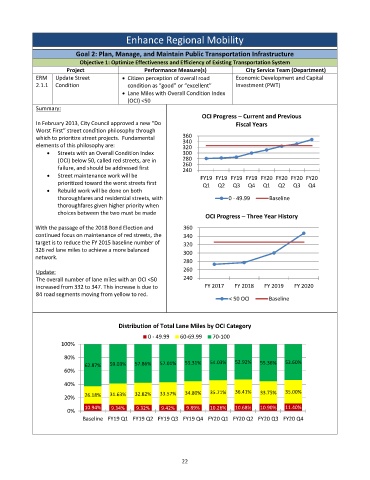
In February 2013, City Council approved a new “Do Fiscal Years
Worst First” street condition philosophy through
which to prioritize street projects. Fundamental 360
340
elements of this philosophy are: 320
Streets with an Overall Condition Index 300
(OCI) below 50, called red streets, are in 280
260
failure, and should be addressed first 240
Street maintenance work will be FY19 FY19 FY19 FY19 FY20 FY20 FY20 FY20
prioritized toward the worst streets first Q1 Q2 Q3 Q4 Q1 Q2 Q3 Q4
Rebuild work will be done on both
thoroughfares and residential streets, with 0 ‐ 49.99 Baseline
thoroughfares given higher priority when
choices between the two must be made OCI Progress –Three Year History
With the passage of the 2018 Bond Election and 360
continued focus on maintenance of red streets, the 340
target is to reduce the FY 2015 baseline number of 320
326 red lane miles to achieve a more balanced
300
network.
280
Update: 260
The overall number of lane miles with an OCI <50 240
increased from 332 to 347. This increase is due to FY 2017 FY 2018 FY 2019 FY 2020
84 road segments moving from yellow to red.
< 50 OCI Baseline
Distribution of Total Lane Miles by OCI Category
0 ‐ 49.99 60‐69.99 70‐100
100%
80%
62.87% 59.03% 57.86% 57.01% 55.31% 54.03% 52.92% 55.36% 53.60%
60%
40%
20% 26.18% 31.63% 32.82% 33.57% 34.80% 35.71% 36.41% 33.75% 35.00%
10.94% 9.34% 9.32% 9.42% 9.89% 10.26% 10.68% 10.90% 11.40%
0%
Baseline FY19 Q1 FY19 Q2 FY19 Q3 FY19 Q4 FY20 Q1 FY20 Q2 FY20 Q3 FY20 Q4
22