
Page 370 - FY 2009 Proposed Budget
P. 370
95% 2 7,715 22 328 88% 1 80% 19% 82% 570 4,405 177 29,476 6,574 484 119 18 47 91,653
Sept.
95% 2 7,618 20 205 88% 1 76% 23% 75% 412 2,747 60 49,470 513 119 18 47 90,867
Aug.
95% 6 7,884 29 348 77% 1 70% 29% 74% 585 5,743 79 22,621 551 118 18 48 89,232
July
94% 2 6,778 34 402 79% 1 76% 23% 6% 304 4,427 103 10,743 4,001 460 118 17 47 88,700
June
93% 3 8 100% 100% 5,965 28 244 87% 1 77% 23% 3% 140 2,102 62 26,450 438 118 18 47 87,737
May
91% 1 4,303 28 261 90% 2 85% 15% 0% 295 1,496 35 82,017 598 118 18 48 86,535
April
70% 72% 59% 51% 55% 75% 90% 6 5,872 11 358 93% 1 73% 25% 11% 839 3,425 482 18,656 5,565 1,246 141 18 49 84,232
Mar.
92% 2 7,625 3 447 92% 1 70% 27% 54% 700 6,867 1,324 37,989 7 $100,225 3,336 183 18 49 83,214
Feb.
93% 5 7,286 8 413 87% 1 60% 36% 27% 816 7,009 1,051 31,417 2,107 183 18 47 81,807
Jan.
103% 7 High 6,822 5 357 87% 1 53% 45% 16% 1,016 6,308 918 7,170 8,114 2,074 218 24 51 80,876 40 5
Dec. Performer
104% 2 7,273 21 390 81% 1 65% 32% 14% 839 7,994 1,162 4,298 2,228 218 25 56 79,698 13
Nov.
105% 3 8,168 20 447 80% 1 68% 24% 39% 815 9,186 1,532 18,035 2,510 217 25 252 56 78,821 9
Oct.
70% 72% 59% 51% 55% 75% 96% 41 High 8 100% 100% 83,309 229 4,200 86% 1 71% 27% 34% 7,331 61,710 7,284 338,342 7 $100,225 24,254 16,545 119 18 252 47 91,653 40 13 14
FY 2020 Actual Performer
95% 10 23,217 71 881 84% 1 75% 24% 77% 1,567 12,896 317 101,567 6,574 1,548 119 17 47 91,653
FY 2020 4th Qtr. Actual
92% 6 8 100% 100% 17,046 90 907 85% 1 79% 20% 3% 739 8,025 200 119,210 4,001 1,496 118 17 47 88,700
FY 2020 3rd Qtr. Actual
70% 72% 59% 51% 55% 75% 92% 13 20,783 22 1,218 91% 1 68% 29% 31% 2,355 17,301 2,857 88,062 7 $100,225 5,565 6,689 141 18 49 84,232
FY 2020 2nd Qtr. Actual
FY 2020 1st Qtr. Actual 104% 12 High Performer 22,263 46 1,194 83% 1 62% 34% 23% 2,670 23,488 3,612 29,503 8,114 6,812 218 24 252 51 80,876 40 13 14
71% 73% 61% 57% 59% 75% 99% 63 High 14 100% 100% 80,000 200 5,941 79% 3 58% 35% 100% 10,000 116,500 20,000 200,000 10 $125,000 42,000 35,000 230 30 200 60 +45,000 45 45 12
FY 2020 Annual Target Performer
69% 71% 59% 55% 57% 73% 105% 65 High 6 100% 100% 87,474 104 5,171 80% 2 48% 36% 14,723 116,034 18,390 292,315 $150,000 43,743 28,991 217 25 223 49 77,312 24 11 5
FY 2019 Actual Performer 14
69% 71% 64% 59% 61% 79% 104% 67 7 100% 100% 81,867 144 6,020 79% 1 47% 25% 15,376 119,855 19,654 41,568 33,577 234 28 223 54 60,096 50 40 8
FY 2018 Actual New Measure in FY 2020
73% 77% 67% 58% 61% 78% 100% 87 New Measure in FY 2019 11 100% 100% 87,290 257 6,553 77% 2 82% 37% 13,892 124,186 24,002 New Measure in FY 2019 New Measure in FY 2019 New Measure in FY 2019 38,495 29,443 227 43 196 55 32,851 78 27 New Measure in FY 2018
FY 2017
Actual
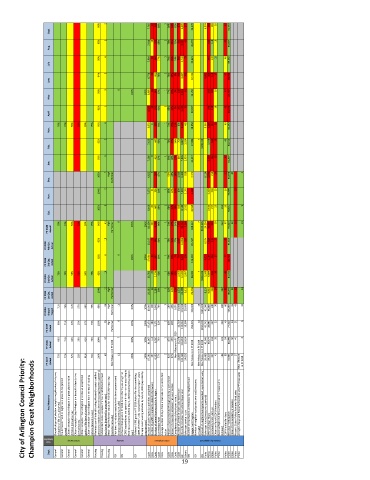
City of Arlington Council Priority: Champion Great Neighborhoods Key Measures Overall citizen satisfaction rating for neighborhood in terms of quality of life [annual survey] Would recommend Arlington as a place to live [annual survey] Citizen perception that Arlington is a great place to raise children [annual survey] Citizen perception that Arlington is a beautiful place to live [annual survey] Citizen perception that Arlington provides an exceptional quality of l
Categories
Code Compliance
Citizen Survey
Housing
Goal
Housing
Housing
General
General
General
Dept.
General
Housing
General
General
Code
Code
Code
Code
Code
Code
Code
Code
Code
OSI
OSI
OSI
HR
19 Library OSI OSI OSI Parks Police Police Police Police Community Engagement Police Police Police Police Police