Page 222 - Southlake FY20 Budget
P. 222

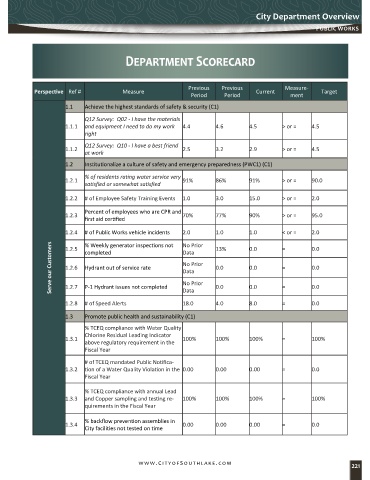
City Department Overview

                                                                                                          PUBLIC WORKS


                                           Department Scorecard


                                                               Previous   Previous             Measure-
            Perspective Ref #             Measure                                     Current              Target
                                                                Period     Period                ment
                       1.1   Achieve the highest standards of safety & security (C1)

                             Q12 Survey:  Q02 - I have the materials
                       1.1.1  and equipment I need to do my work   4.4  4.6        4.5        > or =    4.5
                             right
                             Q12 Survey:  Q10 - I have a best friend
                       1.1.2                                 2.5        3.2        2.9        > or =    4.5
                             at work
                       1.2   Institutionalize a culture of safety and emergency preparedness (PWC1) (C1)

                             % of residents rating water service very
                       1.2.1                                 91%        86%        91%        > or =    90.0
                             satisfied or somewhat satisfied
                       1.2.2  # of Employee Safety Training Events  1.0  3.0       15.0       > or =    2.0

                             Percent of employees who are CPR and
                       1.2.3                                 70%        77%        90%        > or =    95.0
                             first aid certified
                       1.2.4  # of Public Works vehicle incidents   2.0  1.0       1.0        < or =    2.0

                                                             No Prior
                             % Weekly generator inspections not
                  Serve our Customers  1.2.6  Hydrant out of service rate   Data  0.0  0.0    =         0.0
                       1.2.5
                                                                                   0.0
                                                                        13%
                                                                                              =
                                                                                                        0.0
                             completed
                                                             No Prior
                                                             Data
                                                             No Prior
                       1.2.7  P-1 Hydrant issues not completed
                                                             18.0
                                                                                   8.0
                                                                                                        0.0
                                                                                              =
                       1.2.8  # of Speed Alerts              Data       0.0        0.0        =         0.0
                                                                        4.0
                       1.3   Promote public health and sustainability (C1)
                             % TCEQ compliance with Water Quality
                             Chlorine Residual Leading Indicator
                       1.3.1                                 100%       100%       100%       =         100%
                             above regulatory requirement in the
                             Fiscal Year
                             # of TCEQ mandated Public Notifica-
                       1.3.2  tion of a Water Quality Violation in the  0.00  0.00  0.00      =         0.0
                             Fiscal Year

                             % TCEQ compliance with annual Lead
                       1.3.3  and Copper sampling and testing re-  100%  100%      100%       =         100%
                             quirements in the Fiscal Year

                             % backflow prevention assemblies in
                       1.3.4                                 0.00       0.00       0.00       =         0.0
                             City facilities not tested on time


                                               www.CityofSouthlake.com                                               221
   217   218   219   220   221   222   223   224   225   226   227