Page 225 - Southlake FY20 Budget
P. 225

City Department Overview

      PUBLIC WORKS


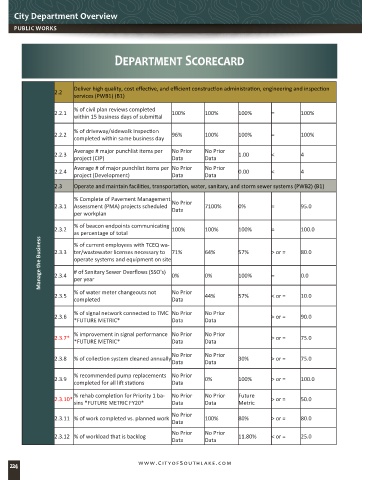
                                       Department Scorecard


                         Deliver high quality, cost effective, and efficient construction administration, engineering and inspection
                   2.2
                         services (PWB1) (B1)
                         % of civil plan reviews completed
                   2.2.1                                  100%       100%       100%       =         100%
                         within 15 business days of submittal
                         % of driveway/sidewalk Inspection
                   2.2.2                                  96%        100%       100%       =         100%
                         completed within same business day
                         Average # major punchlist items per   No Prior   No Prior
                   2.2.3                                                        1.00       <         4
                         project (CIP)                    Data       Data
                         Average # of major punchlist items per  No Prior   No Prior
                   2.2.4                                                        0.00       <         4
                         project (Development)            Data       Data
                   2.3   Operate and maintain facilities, transportation, water, sanitary, and storm sewer systems (PWB2) (B1)
                         % Complete of Pavement Management
                   2.3.1  Assessment (PMA) projects scheduled   No Prior   7100%  0%       =         95.0
                                                          Data
                         per workplan
                         % of beacon endpoints communicating
                   2.3.2                                  100%       100%       100%       =         100.0
                         as percentage of total
              Manage the Business  2.3.3  ter/wastewater licenses necessary to  71%  64%  57%  > or =  80.0
                         % of current employees with TCEQ wa-

                         operate systems and equipment on site
                         # of Sanitary Sewer Overflows (SSO's)
                                                                                                     0.0
                                                                     0%
                                                          0%
                   2.3.4
                                                                                           =
                                                                                100%
                         per year
                   2.3.5  % of water meter changeouts not   No Prior   44%      57%        < or =    10.0
                         completed                        Data
                         % of signal network connected to TMC  No Prior   No Prior
                   2.3.6                                                                   > or =    90.0
                         *FUTURE METRIC*                  Data       Data
                         % improvement in signal performance  No Prior   No Prior
                   2.3.7*                                                                  > or =    75.0
                         *FUTURE METRIC*                  Data       Data
                                                          No Prior   No Prior
                   2.3.8  % of collection system cleaned annually               30%        > or =    75.0
                                                          Data       Data

                         % recommended pump replacements  No Prior
                   2.3.9                                             0%         100%       > or =    100.0
                         completed for all lift stations   Data
                         % rehab completion for Priority 1 ba-  No Prior   No Prior   Future
                   2.3.10*                                                                 > or =    50.0
                         sins *FUTURE METRIC FY20*        Data       Data       Metric
                                                          No Prior
                   2.3.11 % of work completed vs. planned work       100%       80%        > or =    80.0
                                                          Data
                                                          No Prior   No Prior
                   2.3.12 % of workload that is backlog                         11.80%     < or =    25.0
                                                          Data       Data


    224                                        www.CityofSouthlake.com
   220   221   222   223   224   225   226   227   228   229   230