
Page 207 - Southlake FY20 Budget
P. 207
City Department Overview
PLAnnInG & DEVELOPMEnT SERVICES
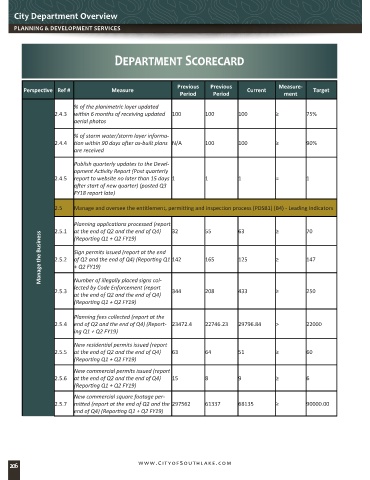
Department Scorecard
Previous Previous Measure-
Perspective Ref # Measure Current Target
Period Period ment
% of the planimetric layer updated
2.4.3 within 6 months of receiving updated 100 100 100 ≥ 75%
aerial photos
% of storm water/storm layer informa-
2.4.4 tion within 90 days after as-built plans N/A 100 100 ≥ 90%
are received
Publish quarterly updates to the Devel-
opment Activity Report (Post quarterly
2.4.5 report to website no later than 15 days 1 1 1 = 1
after start of new quarter) (posted Q3
FY18 report late)
2.5 Manage and oversee the entitlement, permitting and inspection process (PDSB1) (B4) - Leading Indicators
Planning applications processed (report
2.5.1 at the end of Q2 and the end of Q4) 32 55 63 ≥ 70
Manage the Business 2.5.2 Sign permits issued (report at the end 165 125 ≥ 147
(Reporting Q1 + Q2 FY19)
of Q2 and the end of Q4) (Reporting Q1 142
+ Q2 FY19)
lected by Code Enforcement (report
2.5.3 Number of illegally placed signs col- 344 208 433 ≥ 250
at the end of Q2 and the end of Q4)
(Reporting Q1 + Q2 FY19)
Planning fees collected (report at the
2.5.4 end of Q2 and the end of Q4) (Report- 23472.4 22746.23 29796.84 > 22000
ing Q1 + Q2 FY19)
New residential permits issued (report
2.5.5 at the end of Q2 and the end of Q4) 63 64 51 ≥ 60
(Reporting Q1 + Q2 FY19)
New commercial permits issued (report
2.5.6 at the end of Q2 and the end of Q4) 15 8 9 ≥ 6
(Reporting Q1 + Q2 FY19)
New commercial square footage per-
2.5.7 mitted (report at the end of Q2 and the 297562 61337 68135 ≥ 90000.00
end of Q4) (Reporting Q1 + Q2 FY19)
206 www.CityofSouthlake.com