Page 164 - Southlake FY20 Budget
P. 164

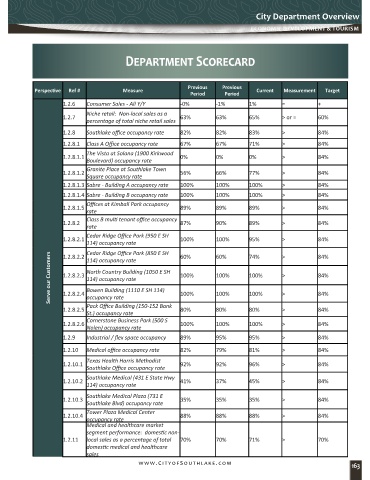
City Department Overview

                                                                                    ECOnOMIC DEVELOPMEnT & TOURISM


                                           Department Scorecard


                                                               Previous    Previous
             Perspective  Ref #           Measure                                     Current   Measurement  Target
                                                                Period     Period
                      1.2.6   Consumer Sales - All Y/Y       -0%        -1%        1%         =           +
                              Niche retail:  Non-local sales as a
                      1.2.7                                  63%        63%        65%        > or =      60%
                              percentage of total niche retail sales
                      1.2.8   Southlake office occupancy rate  82%      82%        83%        >           84%

                      1.2.8.1  Class A Office occupancy rate  67%       67%        71%        >           84%
                              The Vista at Solana (1900 Kirkwood
                      1.2.8.1.1                              0%         0%         0%         >           84%
                              Boulevard) occupancy rate
                              Granite Place at Southlake Town
                      1.2.8.1.2                              56%        66%        77%        >           84%
                              Square occupancy rate
                      1.2.8.1.3 Sabre - Building A occupancy rate  100%  100%      100%       >           84%
                      1.2.8.1.4 Sabre - Building B occupancy rate  100%  100%      100%       >           84%
                              Offices at Kimball Park occupancy
                      1.2.8.1.5                              89%        89%        89%        >           84%
                              rate
                              Class B multi tenant office occupancy
                      1.2.8.2                                87%        90%        89%        >           84%
                              rate
                              Cedar Ridge Office Park (950 E SH
                      1.2.8.2.1                              100%       100%       95%        >           84%
                              114) occupancy rate            60%        60%        74%        >           84%
                              Cedar Ridge Office Park (850 E SH
                  Serve our Customers  1.2.8.2.3  North Country Building (1050 E SH   100%  100%  100%  >  84%
                      1.2.8.2.2
                              114) occupancy rate

                              114) occupancy rate
                              Bowen Building (1110 E SH 114)
                                                                                              >
                                                                                   100%
                                                                        100%
                                                             100%
                      1.2.8.2.4
                                                                                                          84%
                              Pack Office Building (150-152 Bank
                      1.2.8.2.5  occupancy rate              80%        80%        80%        >           84%
                              St.) occupancy rate
                              Cornerstone Business Park (500 S
                      1.2.8.2.6                              100%       100%       100%       >           84%
                              Nolen) occupancy rate
                      1.2.9   Industrial / flex space occupancy  89%    95%        95%        >           84%
                      1.2.10  Medical office occupancy rate  82%        79%        81%        >           84%
                              Texas Health Harris Methodist
                      1.2.10.1                               92%        92%        96%        >           84%
                              Southlake Office occupancy rate
                              Southlake Medical (431 E State Hwy
                      1.2.10.2                               41%        37%        45%        >           84%
                              114) occupancy rate
                              Southlake Medical Plaza (731 E
                      1.2.10.3                               35%        35%        35%        >           84%
                              Southlake Blvd) occupancy rate
                              Tower Plaza Medical Center
                      1.2.10.4                               88%        88%        88%        >           84%
                              occupancy rate
                              Medical and healthcare market
                              segment performance:  domestic non-
                      1.2.11  local sales as a percentage of total   70%  70%      71%        >           70%
                              domestic medical and healthcare
                              sales
                                               www.CityofSouthlake.com                                               163
   159   160   161   162   163   164   165   166   167   168   169