Page 56 - Haltom City FY20 Approved Budget
P. 56

City of Haltom City Annual Budget, FY 2020
                                                                                        General Fund


           FINANCE


                                                                Actual      Adopted     Projected     Proposed
           EXPENDITURES                                         FY 2018     FY 2019      FY 2019       FY 2020
           Personnel                                            $561,453     $583,639     $565,971      $583,017
           Operations                                             39,101       46,037       60,617        64,877
           Total                                                $600,555     $629,676     $626,588      $647,894


                                                                Actual      Adopted     Projected     Proposed
           STAFFING                              Class Range    FY 2018     FY 2019      FY 2019       FY 2020
           Director of Finance                   2101    86        1           1            1             1
           Assistant Director of Finance/Controller  2102  70      1           1            1             1
           Purchasing Agent                      2401    61        1           1            1             1
           Budget Analyst/Accountant             2201    59        1           1            1             1
           Account Technician                    2202    43        2           2            2             1
           Total                                                  6            6            6            5


                                                                                           Estimate
           PERFORMANCE MEASURES                                 Actual FY2017  Actual FY2018  FY2019  Target FY2020
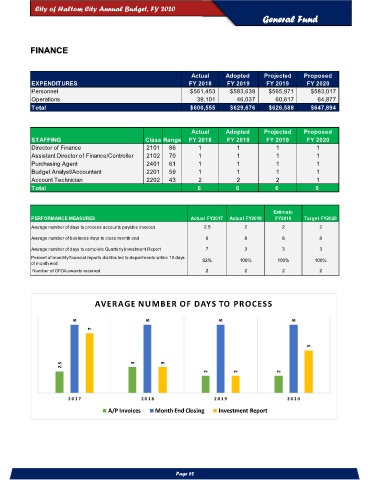
           Average number of days to process accounts payable invoices  2.5       2           2            2

           Average number of business days to close month end        8            8           8            8
           Average number of days to complete Quarterly Investment Report  7      3           3            3
           Percent of monthly financial reports distributed to departments within 10 days   92%  100%  100%  100%
           of month end
            Number of GFOA awards received                           2            2           2            2


                                AVERAGE NUMBER OF DAYS TO PROCESS


                          8                       8                        8                       8
                               7

                                                                                                        5


                     2.5                     3         3
                                                                      2         2             2


                        2 017                   20 18                   2 019                   20 20
                                     A/P Invoices   Month End Closing    Investment Report


                                                           Page 52
   51   52   53   54   55   56   57   58   59   60   61