Page 58 - Haltom City FY20 Approved Budget
P. 58

City of Haltom City Annual Budget, FY 2020
                                                                                        General Fund


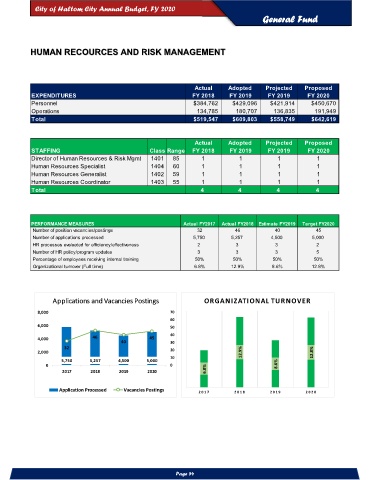
           HUMAN RECOURCES AND RISK MANAGEMENT


                                                                 Actual      Adopted     Projected    Proposed
           EXPENDITURES                                          FY 2018     FY 2019      FY 2019      FY 2020
           Personnel                                             $384,762     $429,096    $421,914      $450,670
           Operations                                             134,785      180,707      136,835      191,949
           Total                                                 $519,547     $609,803    $558,749      $642,619


                                                                 Actual      Adopted     Projected    Proposed
           STAFFING                                Class Range   FY 2018     FY 2019      FY 2019      FY 2020
           Director of Human Resources & Risk Mgmt  1401  85        1           1            1            1
           Human Resources Specialist              1404   60        1           1            1            1
           Human Resources Generalist              1402   59        1           1            1            1
           Human Resources Coordinator             1403   55        1           1            1            1
           Total                                                   4            4            4            4


           PERFORMANCE MEASURES                               Actual FY2017  Actual FY2018  Estimate FY2019  Target FY2020
            Number of position vacancies/postings                 32           46           40            45
            Number of applications processed                     5,750       5,257         4,500        5,000
            HR processes evaluated for efficiency/effectiveness   2            3            3             2
            Number of HR policy/program updates                   3            3            3             5
            Percentage of employees receiving internal training   50%         50%          50%           50%
            Organizational turnover (Full time)                  6.8%        12.9%         8.6%         12.8%


                  Applications and Vacancies Postings                ORGANIZATIONAL TURNOVER

             8,000                                       70
                                                         60
             6,000                                       50
                                                         40
             4,000              46                 45
                                         40              30
                      32
             2,000                                       20                      12.9%                   12.8%
                                                         10
                     5,750     5,257    4,500     5,000
                0                                        0                                   8.6%
                      2017     2018     2019      2020               6.8%

                     Application Processed  Vacancies Postings
                                                                   20 17       2 01 8     20 19       2 02 0


                                                           Page 54
   53   54   55   56   57   58   59   60   61   62   63