Page 72 - Haltom City FY19 Annual Budget
P. 72

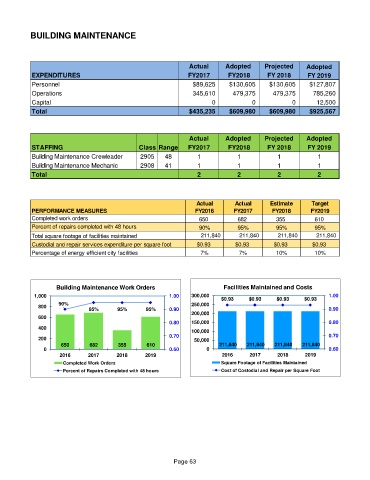
BUILDING MAINTENANCE


                                                                Actual      Adopted      Projected    Adopted
            EXPENDITURES                                       FY2017       FY2018       FY 2018       FY 2019
            Personnel                                            $89,625     $130,605     $130,605     $127,807
            Operations                                           345,610      479,375      479,375       785,260
            Capital                                                    0            0             0       12,500
            Total                                               $435,235     $609,980     $609,980     $925,567


                                                                Actual      Adopted      Projected    Adopted
            STAFFING                           Class Range     FY2017       FY2018       FY 2018       FY 2019
            Building Maintenance Crewleader    2905     48        1             1            1            1
            Building Maintenance Mechanic      2908     41        1             1            1            1
            Total                                                 2             2            2            2


                                                                  Actual       Actual     Estimate      Target
            PERFORMANCE MEASURES                                  FY2016      FY2017       FY2018       FY2019
            Completed work orders                                  650          682         355          610
            Percent of repairs completed with 48 hours             90%          95%         95%          95%
            Total square footage of facilities maintained               211,840           211,840           211,840           211,840
            Custodial and repair services expenditure per square foot  $0.93   $0.93        $0.93       $0.93
            Percentage of energy efficient city facilities         7%           7%          10%          10%


                    Building Maintenance Work Orders                       Facilities Maintained and Costs
            1,000                                        1.00   300,000   $0.93    $0.93     $0.93    $0.93   1.00
              800   90%       95%       95%      95%     0.90   250,000                                       0.90

              600                                               200,000
                                                         0.80   150,000                                       0.80
              400                                               100,000
              200                                        0.70    50,000                                       0.70
                     650       682      355       610                     211,840   211,840   211,840   211,840
                0                                        0.60        0                                        0.60
                     2016     2017      2018     2019                     2016      2017     2018     2019
                      Completed Work Orders                               Square Footage of Facilities Maintained
                      Percent of Repairs Completed with 48 hours          Cost of Costodial and Repair per Square Foot


                                                          Page 63
   67   68   69   70   71   72   73   74   75   76   77