
Page 70 - Haltom City FY19 Annual Budget
P. 70
FLEET SERVICES
Actual Adopted Projected Adopted
EXPENDITURES FY2017 FY2018 FY 2018 FY 2019
Personnel $313,577 $337,509 $302,264 $260,630
Operations 184,675 94,555 94,555 317,334
Total $498,252 $432,064 $396,819 $577,964
Actual Adopted Projected Adopted
STAFFING Class Range FY2017 FY2018 FY 2018 FY 2019
Fleet Services Coordinator 1903 52 1 0 0 0
Senior Auto Mechanic 1902 50 1 1 1 1
Auto Mechanic 1904 44 2 2 2 2
Fleet Service Worker 1905 34 1 1 1 1
Total 5 4 4 4
Actual Actual Estimate Target
PERFORMANCE MEASURES FY2016 FY2017 FY2018 FY2019
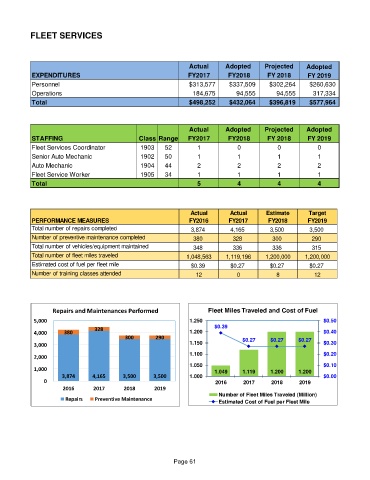
Total number of repairs completed 3,874 4,165 3,500 3,500
Number of preventive maintenance completed 380 328 300 290
Total number of vehicles/equipment maintained 348 336 336 315
Total number of fleet miles traveled 1,048,563 1,119,196 1,200,000 1,200,000
Estimated cost of fuel per fleet mile $0.39 $0.27 $0.27 $0.27
Number of training classes attended 12 0 8 12
Repairs and Maintenances Performed Fleet Miles Traveled and Cost of Fuel
5,000 1.250 $0.50
$0.39
328
4,000 380 1.200 $0.40
300 290 $0.27 $0.27 $0.27
3,000 1.150 $0.30
1.100 $0.20
2,000
1.050 $0.10
1,000 1.049 1.119 1.200 1.200
3,874 4,165 3,500 3,500 1.000 $0.00
0 2016 2017 2018 2019
2016 2017 2018 2019
Number of Fleet Miles Traveled (Million)
Repairs Preventive Maintenance
Estimated Cost of Fuel per Fleet Mile
Page 61