
Page 45 - Fort Worth City Budget 2019
P. 45
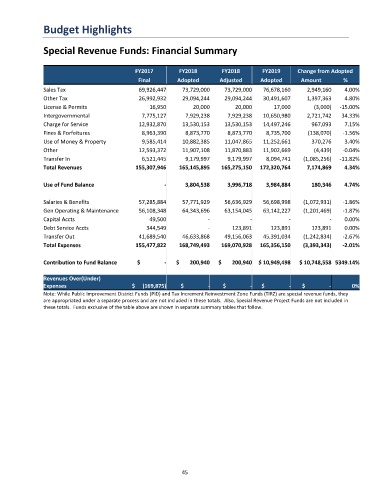
Budget Highlights


               Special Revenue Funds: Financial Summary


                                              FY2017        FY2018        FY2018        FY2019     Change from Adopted
                                               Final        Adopted       Adjusted     Adopted       Amount        %
               Sales Tax                       69,926,447    73,729,000    73,729,000   76,678,160     2,949,160   4.00%
               Other Tax                       26,992,932    29,094,244    29,094,244   30,491,607     1,397,363   4.80%
               License & Permits                  16,950         20,000        20,000       17,000       (3,000)  -15.00%
               Intergovernmental                7,775,127     7,929,238     7,929,238   10,650,980     2,721,742  34.33%
               Charge for Service              12,932,870    13,530,153    13,530,153   14,497,246      967,093    7.15%
               Fines & Forfeitures              8,963,390     8,873,770     8,873,770    8,735,700     (138,070)  -1.56%
               Use of Money & Property          9,585,414    10,882,385    11,047,865   11,252,661      370,276    3.40%
               Other                           12,593,372    11,907,108    11,870,883   11,902,669       (4,439)  -0.04%
               Transfer In                      6,521,445     9,179,997     9,179,997    8,094,741   (1,085,256)  -11.82%
               Total Revenues                 155,307,946   165,145,895   165,275,150  172,320,764     7,174,869   4.34%

               Use of Fund Balance                     -      3,804,538     3,996,718    3,984,884      180,346    4.74%


               Salaries & Benefits             57,285,884    57,771,929    56,636,929   56,698,998   (1,072,931)  -1.86%
               Gen Operating & Maintenance     56,108,348    64,343,696    63,154,045   63,142,227   (1,201,469)  -1.87%
               Capital Accts                      49,500              -             -            -            -    0.00%
               Debt Service Accts                344,549              -       123,891      123,891      123,891    0.00%
               Transfer Out                    41,689,540    46,633,868    49,156,063   45,391,034   (1,242,834)  -2.67%
               Total Expenses                 155,477,822   168,749,493   169,070,928  165,356,150   (3,393,343)  -2.01%

               Contribution to Fund Balance   $                -  $       200,940  $       200,940  $ 10,949,498  $ 10,748,558 5349.14%


               Revenues Over(Under)
               Expenses                      $     (169,875)  $                -  $                -  $                -  $                -  0%
               Note: While Public Improvement District Funds (PID) and Tax Increment Reinvestment Zone Funds (TIRZ) are special revenue funds, they
               are appropriated under a separate process and are not included in these totals.  Also, Special Revenue Project Funds are not included in
               these totals.  Funds exclusive of the table above are shown in separate summary tables that follow.


                                                             45