
Page 42 - Fort Worth City Budget 2019
P. 42
Budget Highlights
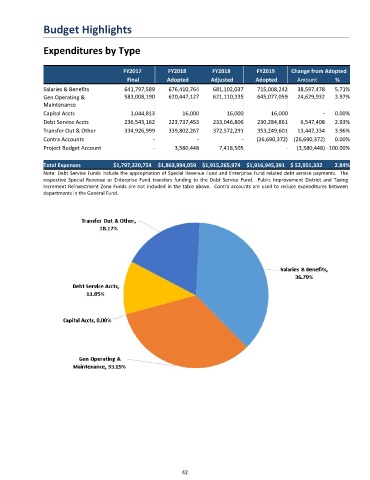
Expenditures by Type
FY2017 FY2018 FY2018 FY2019 Change from Adopted
Final Adopted Adjusted Adopted Amount %
Salaries & Benefits 641,797,589 676,410,764 681,102,037 715,008,242 38,597,478 5.71%
Gen Operating & 583,008,190 620,447,127 621,110,335 645,077,059 24,629,932 3.97%
Maintenance
Capital Accts 1,044,813 16,000 16,000 16,000 - 0.00%
Debt Service Accts 236,543,162 223,737,453 233,046,806 230,284,861 6,547,408 2.93%
Transfer Out & Other 334,926,999 339,802,267 372,572,291 353,249,601 13,447,334 3.96%
Contra Accounts - - - (26,690,372) (26,690,372) 0.00%
Project Budget Account - 3,580,448 7,418,505 - (3,580,448) -100.00%
Total Expenses $1,797,320,754 $1,863,994,059 $1,915,265,974 $1,916,945,391 $ 52,951,332 2.84%
Note: Debt Service Funds include the appropriation of Special Revenue Fund and Enterprise Fund related debt service payments. The
respective Special Revenue or Enterprise Fund transfers funding to the Debt Service Fund. Public Improvement District and Taxing
Increment Reinvestment Zone Funds are not included in the table above. Contra accounts are used to reduce expenditures between
departments in the General Fund.
42