
Page 44 - Fort Worth City Budget 2019
P. 44
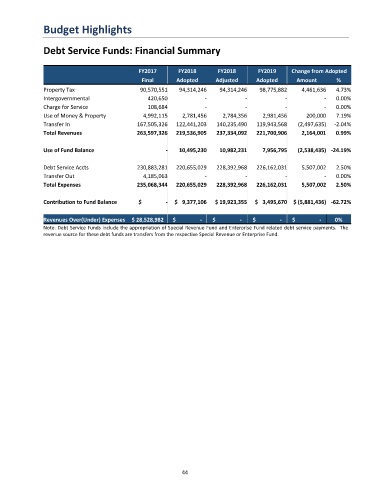
Budget Highlights


               Debt Service Funds: Financial Summary


                                               FY2017       FY2018       FY2018       FY2019     Change from Adopted
                                                Final      Adopted      Adjusted      Adopted      Amount       %
               Property Tax                    90,570,551   94,314,246    94,314,246   98,775,882    4,461,636  4.73%
               Intergovernmental                  420,650            -            -            -            -   0.00%
               Charge for Service                 108,684            -            -            -            -   0.00%
               Use of Money & Property          4,992,115    2,781,456     2,784,356    2,981,456     200,000   7.19%
               Transfer In                    167,505,326  122,441,203   140,235,490  119,943,568   (2,497,635)  -2.04%
               Total Revenues                 263,597,326  219,536,905   237,334,092  221,700,906    2,164,001  0.99%

               Use of Fund Balance                      -   10,495,230    10,982,231    7,956,795   (2,538,435) -24.19%


               Debt Service Accts             230,883,281  220,655,029   228,392,968  226,162,031    5,507,002  2.50%
               Transfer Out                     4,185,063            -            -            -            -   0.00%
               Total Expenses                 235,068,344  220,655,029   228,392,968  226,162,031    5,507,002  2.50%


               Contribution to Fund Balance    $                -  $   9,377,106  $ 19,923,355  $   3,495,670  $ (5,881,436) -62.72%

               Revenues Over(Under) Expenses  $ 28,528,982  $                -  $                -  $                -  $                -  0%
               Note: Debt Service Funds include the appropriation of Special Revenue Fund and Enterprise Fund related debt service payments.   The
               revenue source for these debt funds are transfers from the respective Special Revenue or Enterprise Fund.


                                                             44