
Page 40 - Fort Worth City Budget 2019
P. 40
Budget Highlights
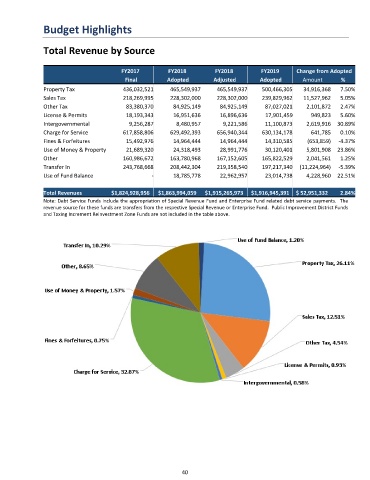
Total Revenue by Source
FY2017 FY2018 FY2018 FY2019 Change from Adopted
Final Adopted Adjusted Adopted Amount %
Property Tax 436,032,521 465,549,937 465,549,937 500,466,305 34,916,368 7.50%
Sales Tax 218,269,995 228,302,000 228,302,000 239,829,962 11,527,962 5.05%
Other Tax 83,380,370 84,925,149 84,925,149 87,027,021 2,101,872 2.47%
License & Permits 18,193,343 16,951,636 16,896,636 17,901,459 949,823 5.60%
Intergovernmental 9,256,287 8,480,957 9,221,586 11,100,873 2,619,916 30.89%
Charge for Service 617,858,806 629,492,393 656,940,344 630,134,178 641,785 0.10%
Fines & Forfeitures 15,492,976 14,964,444 14,964,444 14,310,585 (653,859) -4.37%
Use of Money & Property 21,689,320 24,318,493 28,991,776 30,120,401 5,801,908 23.86%
Other 160,986,672 163,780,968 167,152,605 165,822,529 2,041,561 1.25%
Transfer In 243,768,668 208,442,304 219,358,540 197,217,340 (11,224,964) -5.39%
Use of Fund Balance - 18,785,778 22,962,957 23,014,738 4,228,960 22.51%
Total Revenues $1,824,928,956 $1,863,994,059 $1,915,265,973 $1,916,945,391 $ 52,951,332 2.84%
Note: Debt Service Funds include the appropriation of Special Revenue Fund and Enterprise Fund related debt service payments. The
revenue source for these funds are transfers from the respective Special Revenue or Enterprise Fund. Public Improvement District Funds
and Taxing Increment Reinvestment Zone Funds are not included in the table above.
40