
Page 41 - Fort Worth City Budget 2019
P. 41
Budget Highlights
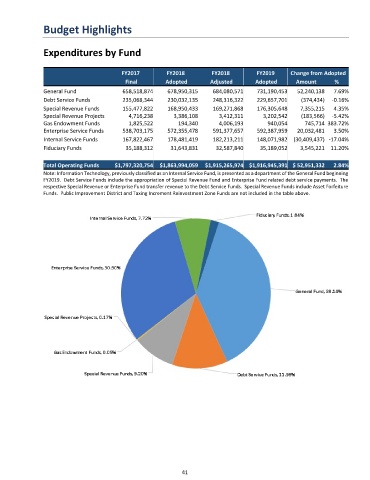
Expenditures by Fund
FY2017 FY2018 FY2018 FY2019 Change from Adopted
Final Adopted Adjusted Adopted Amount %
General Fund 658,518,874 678,950,315 684,080,571 731,190,453 52,240,138 7.69%
Debt Service Funds 235,068,344 230,032,135 248,316,322 229,657,701 (374,434) -0.16%
Special Revenue Funds 155,477,822 168,950,433 169,271,868 176,305,648 7,355,215 4.35%
Special Revenue Projects 4,716,238 3,386,108 3,412,311 3,202,542 (183,566) -5.42%
Gas Endowment Funds 1,825,522 194,340 4,006,193 940,054 745,714 383.72%
Enterprise Service Funds 538,703,175 572,355,478 591,377,657 592,387,959 20,032,481 3.50%
Internal Service Funds 167,822,467 178,481,419 182,213,211 148,071,982 (30,409,437) -17.04%
Fiduciary Funds 35,188,312 31,643,831 32,587,840 35,189,052 3,545,221 11.20%
Total Operating Funds $1,797,320,754 $1,863,994,059 $1,915,265,974 $1,916,945,391 $ 52,951,332 2.84%
Note: Information Technology, previously classified as an Internal Service Fund, is presented as a department of the General Fund beginning
FY2019. Debt Service Funds include the appropriation of Special Revenue Fund and Enterprise Fund related debt service payments. The
respective Special Revenue or Enterprise Fund transfer revenue to the Debt Service Funds. Special Revenue Funds include Asset Forfeiture
Funds. Public Improvement District and Taxing Increment Reinvestment Zone Funds are not included in the table above.
41