
Page 50 - Fort Worth City Budget 2019
P. 50
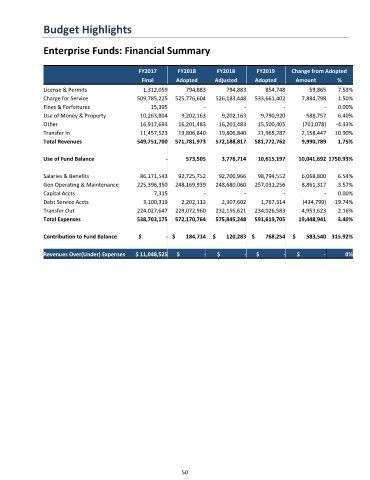
Budget Highlights


               Enterprise Funds: Financial Summary


                                               FY2017       FY2018       FY2018       FY2019      Change from Adopted
                                                Final      Adopted      Adjusted     Adopted       Amount        %
               License & Permits                1,312,059      794,883      794,883      854,748       59,865    7.53%
               Charge for Service             509,785,225  525,776,604  526,183,448  533,661,402     7,884,798   1.50%
               Fines & Forfeitures                 15,395            -            -            -            -    0.00%
               Use of Money & Property         10,263,804    9,202,163    9,202,163    9,790,920      588,757    6.40%
               Other                           16,917,693   16,201,483   16,201,483   15,500,405     (701,078)  -4.33%
               Transfer In                     11,457,523   19,806,840   19,806,840   21,965,287     2,158,447  10.90%
               Total Revenues                 549,751,700  571,781,973  572,188,817  581,772,762     9,990,789   1.75%


               Use of Fund Balance                      -      573,505    3,776,714   10,615,197    10,041,692 1750.93%


               Salaries & Benefits             86,171,543   92,725,752   92,700,966   98,794,552     6,068,800   6.54%
               Gen Operating & Maintenance    225,396,350  248,169,939  248,680,060  257,031,256     8,861,317   3.57%
               Capital Accts                        7,315            -            -            -            -    0.00%
               Debt Service Accts               3,100,319    2,202,113    2,307,602    1,767,314     (434,799)  -19.74%
               Transfer Out                   224,027,647  229,072,960  232,156,621  234,026,583     4,953,623   2.16%
               Total Expenses                 538,703,175  572,170,764  575,845,248  591,619,705    19,448,941   3.40%


               Contribution to Fund Balance    $                - $       184,714  $       120,283 $       768,254  $       583,540 315.92%


               Revenues Over(Under) Expenses  $ 11,048,525  $                -  $                -  $                -  $                -  0%


                                                             50